

Alright, let’s create a practice problem for Excel accounting based on the provided scenario. This problem will involve recording transactions related to undeposited funds and checking account.
Posts in the Accounting Instruction category:

Record Deposits from Owner and Loan 7020 Excel Accounting Problem 2021
In this Excel accounting practice problem, we are entering transactions related to a business startup. The transactions involve recording deposits from the owner and a loan obtained for business purposes. We are using an Excel worksheet with two tabs: “Example” as an answer key and “Practice” for recording transactions.

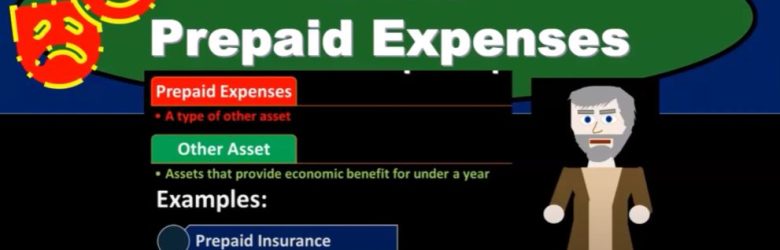
Audit Prepaid Expenses 14110
In this comprehensive presentation, we will delve into the intricacies of auditing prepaid expenses, with a primary focus on the audit process related to prepaid insurance. Prepaid expenses, categorized under other assets, pose unique challenges in the audit process due to the nature of payment preceding the receipt of benefits.

General Standards & Compliance, Accounting Principles & Confidential Client Information 9150
In the dynamic world of accounting, professionals are tasked with the critical responsibility of ensuring financial transparency, adhering to established standards, and safeguarding confidential client information. This presentation dives into the intricate web of general standards, compliance accounting principles, and the delicate handling of confidential client data.
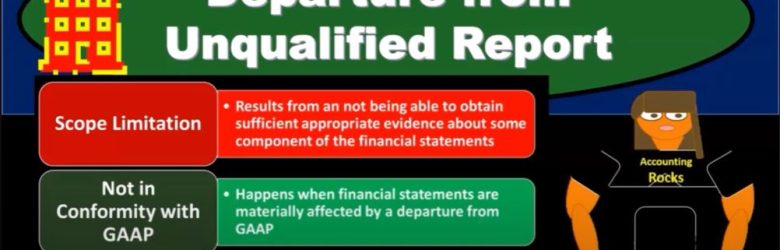
Departure from Unqualified Report 18120 Auditing
In the complex world of financial auditing, the standard unqualified report stands as the pinnacle of assurance, affirming that the financial statements are in conformity with generally accepted accounting principles (GAAP). However, auditors often encounter situations that lead to departures from this standard, raising flags and demanding a closer examination. In this presentation, we delve into the scenarios where deviations occur, the types of reports they may trigger, and the implications for both auditors and the entities being audited.

Effect of Information Technology on Internal Controls 6020 Auditing
In today’s presentation, we delve into the intricate realm of how information technology (IT) shapes and influences internal controls within the business landscape. The fusion of businesses, internal controls, and auditing with advancing technology presents auditors with both opportunities and challenges. It necessitates collaboration with IT specialists to ensure the effective implementation of internal controls. This presentation explores the nuanced landscape, weighing the benefits and potential pitfalls of IT in internal controls.


QuickBooks Software Types & Versions 1010
Introduction
Embarking on the QuickBooks Desktop 2024 journey? Grab your coffee and buckle up for a comprehensive exploration of QuickBooks software types and versions. Choosing the right accounting software is crucial, and this blog aims to simplify the decision-making process.

Unearned Revenue – Monthly Invoicing 1175 QuickBooks Desktop 2024
Welcome to a deep dive into QuickBooks Desktop 2024, where we explore the nuances of the new earned revenue feature. In this blog post, we’ll guide you through the steps of monthly invoicing for a subscription-type business, using a sample company file in QuickBooks Desktop Enterprise.