

This presentation we will generate and analyze a summary balance sheet comparing and contrasting it to the standard balance sheet or balance sheet standard report, which is going to be the general balance sheet that will be generated when a balance sheet is created, we will do this within QuickBooks Pro 2020, QuickBooks desktop 2020. Here we are in our get great guitars file, we currently have the open windows open, you can open the open windows by selecting the few drop down up top and the open windows lyst, we’re going to first create actually our standard balance sheet so that we have something to compare the summary balance sheet to so let’s first create this standard balance sheet.

0:36
As we have seen in the past, we go to the reports up top, we’re going to go to the company and financial scroll on down to the company to the balance sheet standard. Here is the balance sheet standard Report, I’m going to change the dates with the customized up top, we’re going to change the dates from a one a 120 to 1230 120, that’s January through December 2020, then I’m going to say Okay, so here’s going to be our balance sheet report. Now you can see that this is a fairly long report, it’s got a lot of sub totals to it. And a decent amount of accounts that will vary, of course from company to company.
1:10
But this is the standard report that we would want. Because typically we want to see those accounts when we’re going back and forth from the data. Because oftentimes, we’ll want to use the auto zoom feature to go into that detail. However, when we give this report to somebody else, we may not they may not want the detail, especially if you’re talking about someone that doesn’t have a lot of financial accounting information, or they don’t work with financial statements a lot, then or even someone that does that just wants the bottom line, they might just be a bottom line person, I just want the sub totals, I don’t need all the detail, then we may not want to provide that.
1:44
So most people that work within QuickBooks will then always be going back and forth to this report as they enter data to see what happens to the particular accounts, either here or to a trial balance report, which gives all the report detail details basically the reports that will be on the list of accounts or Chart of Accounts. In other words, if we go to the lists drop down, and we take a look at the chart of accounts, if we were to generate the standard balance sheet and the standard income statement, or Profit and Loss report, all the accounts here that have a balance in them for that time period would then be displayed on it. Not so with the summary report. But that’s very useful.
2:22
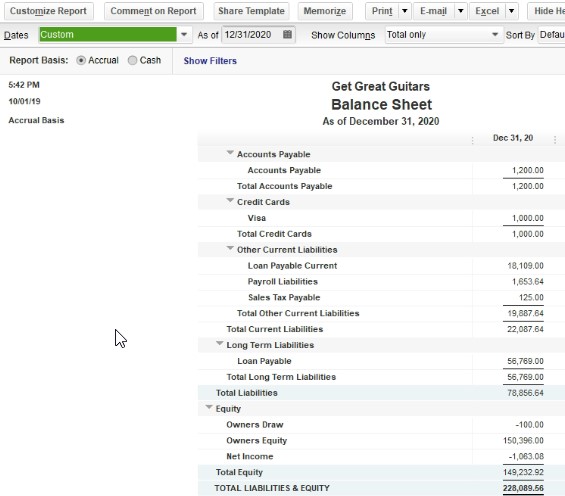
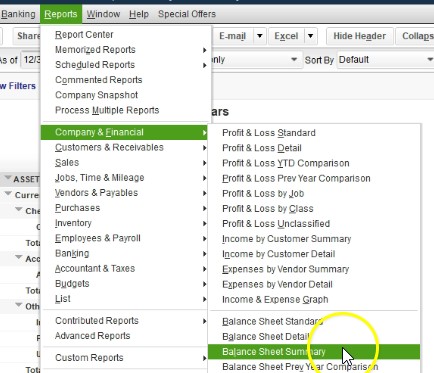
When we’re going back and forth from the reports I just close that out, we’re back to the balance sheet balance sheet report here. Now let’s compare this to the summary report, which is something that’s going to be given by QuickBooks will go to the reports drop down up top, we’re going to go to the company and financial will go down to the balance sheet area, this time choosing the balance sheet summary report, balance sheet summary report, then we’re going to go back up top to the same kind of change to the customized report. And notice you have similar fields up top as we do with adjusting the reports as you will with most reports, we’re going to go to the customized reports.
2:56
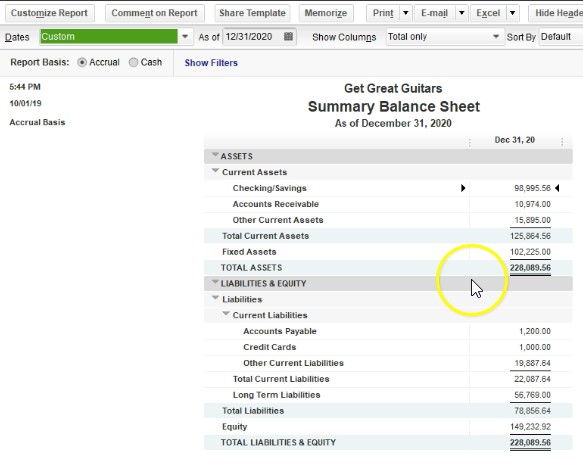
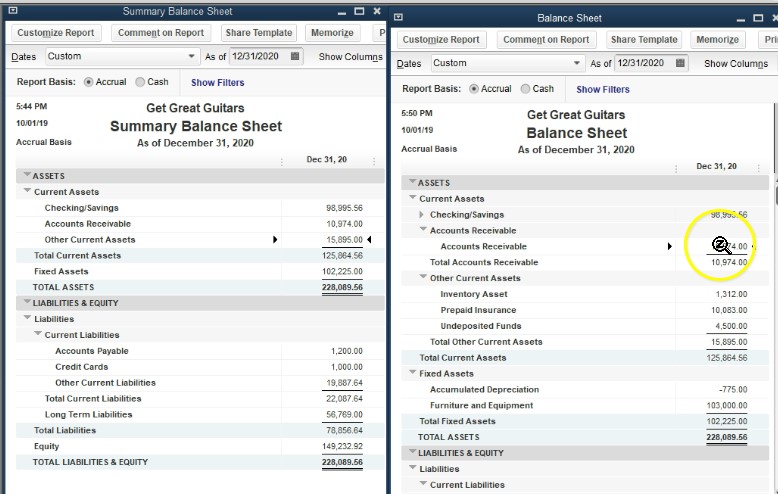
We’re going to adjust the dates from Oh 10120 1230 120, that’s January through December 2020. And okay, and you can see it fits nicely basically on one page. So what do we have here, in this report, we’ve got the checking account, that’s basically the account type, we’ve got the accounts receivable, again, in essence, the account type, we have the other current assets, the account types, what do I mean by that? Notice, if I go to the lists drop down here, we go to the chart of accounts.
3:27
These are the types so whenever we set up an account, we have to set it up as an account type. The account types will typically be in order of assets, liabilities, and then equity, and then income and expense on the profit and loss statement that and then they are further broken out to cash accounts or checking accounts, or bank accounts here. The accounts receivable, other current assets, these are all in the asset category, fixed assets, and and so on. These account types are basically what’s creating the summary report. In other words, going back to the summary report in the open windows, they’re basically grouping by account type. So if we had multiple checking accounts, we only have one in this case, but if we had multiple checking accounts, then they the multiple accounts would be shown here.
4:13
If we had multiple accounts receivable, then they would be grouped together, they wouldn’t be showing they’d be grouped together here. The other current assets had multiple things in it and they’re grouped as just one line item on the account types, we get a nice clean, total current assets then, and then the fixed assets once again grouped together, we have depreciation and the fixed assets here given us the total assets, and then down below same with accounts payable, we only have one of them, and we had multiple, which is unusual. But if we did, if that was the case, it would be grouped together credit cards same. And then we do have multiple accounts for the other current liabilities, we have the subtotal then for the total current liabilities, then the long term liabilities those over a year.
4:55
And that gives us the total liabilities. And then finally, equity. Once again group together, we don’t see draw, we don’t see net income, that of course, our assets equal liabilities plus equity, you can see how much cleaner This is, if you were to look at it considered that this report as opposed to the full balance sheet report. Therefore, what you really generally want to do is you want it when you go into a meeting, if you’re talking to a client, or if you’re talking to a supervisor, or if you’re talking to anyone investor in something like that, you probably want to print the summary report first. And then and then you say, Hey, this is the bottom line numbers.
5:29
That’s the summary report, then you predict what they’re going to ask if they want more detail. Because most of the time, even people that are bottom line people, they say I just want the bottom line, just give me the summary report, and then you’ll give it to them. And then clearly, they’re going to say well, now I’d like to know more about this, or that right. And then you’re going to be ready for that with the more detailed balance sheet report. So give them the summary. And then if people are easily overwhelmed by numbers, hopefully that’ll be as easy as you know, as summarized as you can make it or if you if you deal with someone that wants to just get right to the facts, then they can they can do with that.
6:01
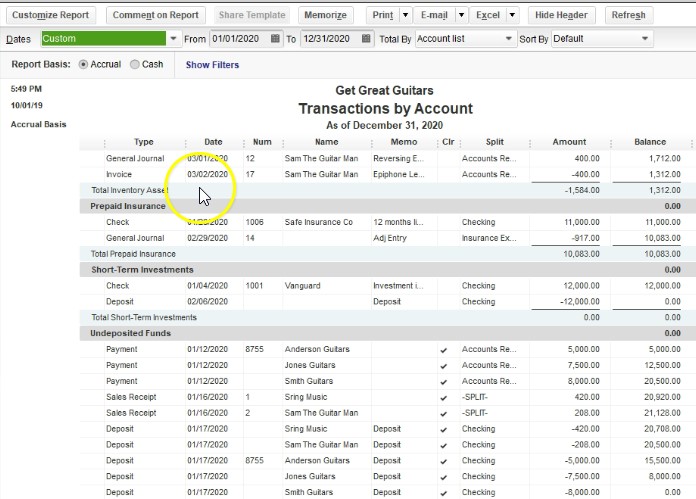
And then just expect of course that more detail will evolve after the conversation goes forward, then you can go to the standard balance sheet report. And then on further details within the account, you know, balance details from that point. Now, when you’re working and putting in data input, you typically won’t use this report because you can’t use the zoom feature as easily. For example, if I was to zoom in this other current asset report like double click on it, then it’s not going to go into one account, it’s got these multiple accounts that are in that are making up that number. So that makes it a little bit more difficult when I’m entering data to a particular account to go back and forth and review the information to that account. That’s why most of the time, most people are most familiar with the standard balance sheet report because as you enter data input, it’s nice to go back to that report. And check the numbers as you do so as we will do when we make it when we make data
6:53
input. I’m going to close this back out. Let’s do a side by side comparison within QuickBooks, which is kind of nice to be able to do, I’m going to maximize the screen. So see this little icon up top, we’re going to select that, and that’ll that’ll make it so we can kind of adjust this window within QuickBooks. So we can adjust this window in here, then if we go to the standard balance sheet, we can do the similar option.
7:18
So it would either be maximized, or you can on maximize it. And then we can maneuver this around like a like a normal windows program, we can put these in a side by side comparison, and see if we can adjust this a little bit nicer. We’ll make this as small as we can, and do side by side here. So then you can see side by side, if we have the checking account, you can see here that I could collapse these and in essence get the same report right? There’s the checking numbers, we only have one of the accounts receivable, if I compress that there’s the accounts receivable, here’s all the things in the other asset accounts, which are making up that 15. If I collapse that account type, then there’s the 15, there’s the total.
8:08
Then if I go to the fixed assets here, here’s the fixed assets. If I collapse the fixed assets, there’s the fixed assets here, we scroll down to the liability side, we’ve got the accounts payable only one thing in accounts payable, if I collapse that there it is, then the visa, we only have one Visa card, if I collapse that there it is. And then we have the other current liabilities. And that includes multiple accounts. If I was to collapse them, it would show them in one account as we see over here. And then we got the total current liabilities and then long term. So if I collapse the long term, we’ve got the 56.
8:42
There we go there and then the equity. So if I was to collapse the equity, then we get the equity section and then the totals down below. So you could see it that’s you know, the comparison between the two reports. If I then maximize the summary report, we’re now going to save it as a PDF file. And then we’ll export it to excel an Excel file that we have already set up and then use that Excel file to print out all the reports we have so far to one PDF file. So I’m going to go up top, we’re going to go to the printing options, we’re going to print the report. And we’re going to use the Q to PDF printer.
9:16
So that’s the one we want. So I’m going to go ahead and say print here. And then we’ll have our where do we want to put it, and we are in section one. So this is the place, I’m actually going to put it into the financial reports folder. However, I like to put this right under the date. And then we’ll change this we’ll just call this the summary, let’s say balance sheet, and this is 2020. I’m going to go ahead and save that. Now I’m going to export it to excel and existing workbook that we have set up for the section we’re going to go to the Excel, create a new worksheet, and then we’re going to put it into an existing workbook.
9:59
Now if you don’t have and existing workbook, you can just create a new one, we’re going to choose the existing workbook for our example, we will then browse to locate that existing workbook. We’re in section one, this is the workbook that we had set up, you can click on it and open it, I like to simply double click on it. So I’m going to double click on it, and then I’m going to export to it. Here we have it, we’re going to do our normal kind of adjustments, that will typically happen, we’re going to have this new sheet popped up.
10:25
So I’m going to get rid of Adam and and go to this new sheet, I’m going to right click on it and delete it. Say Okay, and then here’s our new sheet that we have export it to it, I like to pull this all the way to the right, so I’m going to grab it, and I’m going to pull it all the way to the right. Now note, you know, you might want the summary to be first, right, you might want the summary balance sheet and then the standard. But I’m just going to group them as we have reported them and looked at them in this report. So how you want to group these is you know, you
10:51
have to think about that how you’re going to package your information together when you present it. So then we’re going to say go to the splits. So we can to the Page Layout view so that we can see the splits. And we’re going to say okay, and then up top, I’m going to go to the View up top, we’re going to go to Windows within Windows, I’m going to uncheck the splits. So there now we can see our information there. I’m going to delete this item here, which we could have done in Excel. And then I’m going to go down and double click on the sheet, double click on the sheet.
11:23
I’m going to call this a summary, balance sheet 2020. And there we have it, I’m going to go back to the normal view. And there’s this. Now we have all of these reports here. So I’m going to try to print all of these reports on one PDF file. So we have the balance sheet, the p&l competitive balance sheet, and now the summary balance sheet. If we go to the File tab up top, we can then go to the print option.
11:49
Within the print option, I’m going to select the entire workbook. So we’ll pick the entire workbook, it’s going to the cute PDF printer, we now have five pages scrolling through those pages, they look like so. So now we’re going to go ahead and print this report. It’s going to print to the PDF printer. So here’s our dialog box, I’m going to go back to section one folder. And I’m going to just overlay this this file here I’m going to say save. Yes. And there we have that.
12:21
Let’s take a look at what we have then so far. So if we open up our section one folder, we then have the the Excel file here that we can provide to someone that provides all the documents, we could then give them this file, which is now getting kind of long, we’ve got four documents within it, we could attach all of these separately to an email or we could zip it, I’m going to delete this zip file, we could zip this file, right click and send to a zip file and send it here. Or we can simply send this one PDF file that we created from the Excel document that has the four reports in it, including the balance sheet, as we see here, the profit and loss report, the comparative balance sheet, and then the summary balance sheet. So those are some ways that we can summarize this data provided to someone else or save it in our files.