
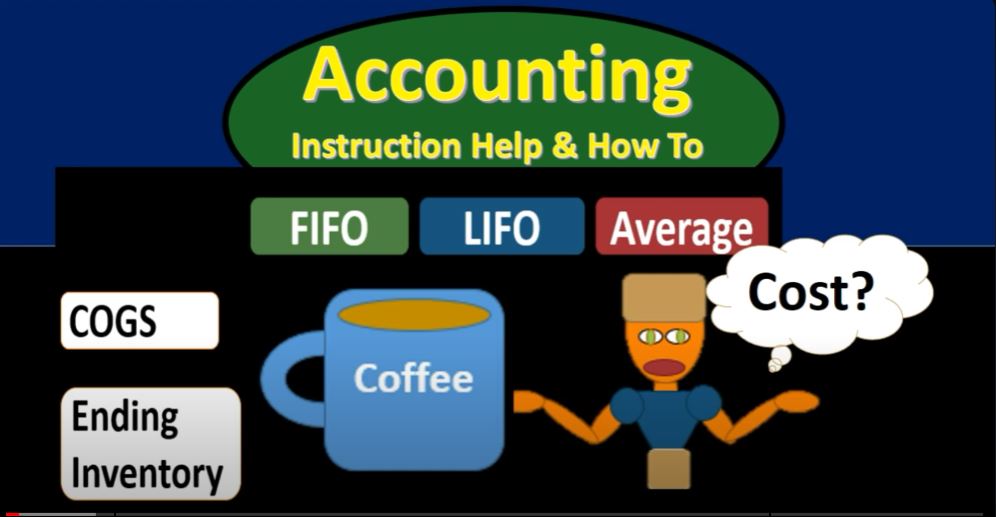
In the world of accounting and inventory management, determining the cost of goods sold and valuing inventory is crucial for accurate financial reporting. There are various methods available to estimate inventory costs, including First In First Out (FIFO), Last In First Out (LIFO), and the Average Cost method. In this blog post, we will delve into these methods and explore how they impact financial statements, particularly in the context of rising prices.
Specific Identification vs. Estimating Methods
Before we dive into the specifics of FIFO, LIFO, and Average Cost methods, it’s essential to understand why we might use estimating methods instead of specific identification. Specific identification is ideal when dealing with distinct, high-value items, like forklifts, where each item has a unique identifier. However, for more homogeneous items with lower values, such as coffee mugs, it becomes impractical to track each item’s cost individually. This is where estimating methods come into play.
FIFO: First In, First Out
First In, First Out, or FIFO, is a widely used method and often the most intuitive. It assumes that the first items purchased are the first ones sold. This method aligns with the common practice of trying to sell older inventory before newer stock, even for non-perishable items like coffee mugs.
Let’s illustrate this with an example:
In January, you buy 8 coffee mugs at $1 each. In April, you buy 5 more coffee mugs at $1.20 each. In July, you purchase additional coffee mugs at $1.50 each.
Now, a customer wants to buy a coffee mug, and you sell it for $5. The FIFO method assumes that the cost of this coffee mug is $1, which is the cost of the oldest inventory in this scenario. Consequently, your cost of goods sold is $1, and your inventory decreases by $1.
After this sale, your ending inventory would be $22.
LIFO: Last In, First Out
While FIFO is the most intuitive, Last In, First Out, or LIFO, assumes that the last items purchased are the first ones sold. This method might seem counterintuitive, as one would typically want to sell older items first, but it can have tax advantages by lowering net income during times of rising prices.
In the same example, if we use LIFO for the sale of the coffee mug, the cost of goods sold is now $1.50, which is the cost of the most recent purchase. This higher cost results in lower net income.
After the sale, your ending inventory would be $21.50.
Average Cost
The Average Cost method takes a middle-ground approach, assuming that the cost of goods sold is the average cost of all inventory items. To calculate the average cost, you divide the total cost of your inventory by the total number of units.
In our example, with an average cost of $1.21, the cost of goods sold for the coffee mug would be $1.21, and your ending inventory would be $21.79.
Comparing the Impact
Now, let’s compare the impact of these methods on your financial statements:
- Net Income: In a period of rising prices, like in our example, FIFO will typically result in the highest net income, while LIFO will yield the lowest. Average cost falls in between.
- Ending Inventory: FIFO will show the highest ending inventory value, LIFO the lowest, and Average Cost again falls in the middle.
In summary, the choice of inventory costing method can significantly impact financial statements and net income, particularly when prices are rising. FIFO tends to make a company look more profitable, while LIFO can provide tax advantages. The Average Cost method offers a compromise between the two. It’s crucial for businesses to understand these methods and choose the one that best aligns with their financial goals and reporting requirements.
In future posts, we’ll explore these inventory methods in more detail and discuss their implications in various business scenarios. Stay tuned for a deeper dive into the world of inventory management!