
0:00
Its presentation and we will take a look at the display options for a balance sheet type report options that will typically be applicable to many other types of reports as well within QuickBooks Pro 2020, QuickBooks desktop 2001 a. Here we are in our get great guitars file, we currently have the open windows open, you can open the open windows by selecting the view drop down up top and go into the open that windows that list, we’re now going to be going to the balance sheet standard report and taking a look at the customized options or the display options within it.

0:31
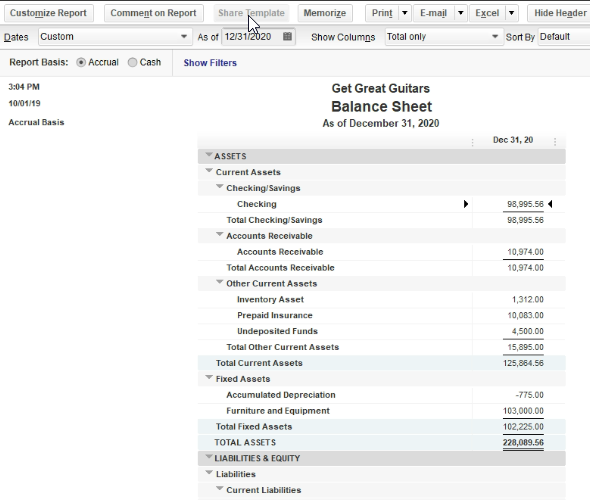
So we will do that by going to the reports drop down up top, we’re going to go to the company and financial and scroll on down to that balance sheet standard type report one of our favorite two types of reports here, we then have the options that are within the report up top. And then we have the customized reports options here, we’re first going to be taking a look at all these options that are in the face of the report set settings are set up.
0:55
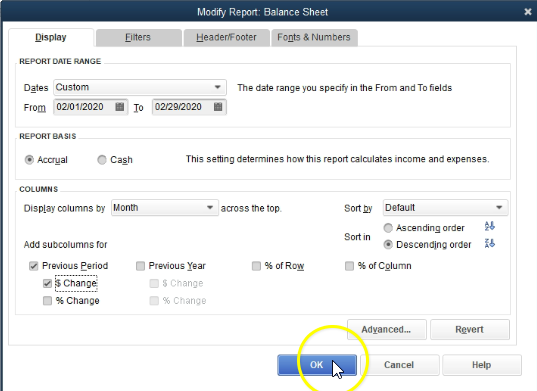
And then we’re going to go into the display options which will be in this customized reports and I open up customized reports, we see the tabs up top, we see the display tabs here, some of these options will be repeated in the two areas or within customized reports. And without as well, I’m going to first change the dates up top, I’m just going to select the one date, you’ll recall that the balance sheet really only needs one date. But if you wanted to see the range, the range is going to help you when you go into that data.
1:25
So I’m going to first start off with 1230 120 January 31 2020. Let’s take a look at some of these options up here. customized reports, we will come back to add a future point, then we have the comments on a report. If you wanted to add the comment on the reports. If you made it changes to a report, then you can share the template you can actually make it a template and we’ll talk about how to make changes later. So we’ll talk about that with regards to the customizing of the reports. And we’ll make different types of reports.
1:57
Once you have the template then that you have taken this standard balance sheet report, in other words and changed it modified it in some way. You could call that a template and basically share the templates that you have created. You can also memorize the reports, which is a great tool for us because it’ll go into that reports, memorized reports, settings, and therefore we can go directly back into it. So if we save changes, and we want to save those changes and have a report that’s going to be customized to us. In other words, if we took this standard balance sheet, we made changes to it, then we want to go back to that report that has the changes. Rather than making them again, we can then memorize the report, we will show how to do this in future presentations.
2:38
We have of course the printing options as we’ve seen in the past, we can print the report here which will print it to the printer, or we can go to and most reports will have this the print to the PDF file. However, not all reports have this as well as including graphs and things like that. And therefore the printing option with the cute PDF printer is something that’s useful to have to have the QP PDF printer or some type of printer that will print to a PDF is a nice tool to have. We’ve we then have the email options so we can send report to as Excel or we can send the report as a PDF.
3:17
So we can actually send it directly out of the QuickBooks system, which is nice. Rather than basically saving the file and then sending it will have to have our email, of course, set up so that we can send it out directly from QuickBooks, then we’re going to have the Excel which we have seen, we create the new worksheet, we will be using this more in the future with multiple different reports, this is an option for many different types of reports as well, we have the collapse rows. So if we had multiple rows, then this could be used to collapse them. We may use this and see this in different types of reports in the future.
3:53
Notice it says no roads with subs found to collapse. In other words, if we were to create sub accounts, those are the type of accounts that would be collapsed. Now know you might be saying, Hey, I got all these little triangles, these collapse things, right. But these actually are not sub accounts. These are the types. So just see what that looks like. If you go to the lists drop down up top and you go to the chart of accounts, you’ll note the types are here. So the the little triangles that are set up are actually the types that are required field for all accounts, the sub account is not a required field. So in other words, if I wanted to create a new account, for example, let’s go into this account by selecting prepaid insurance, selecting the drop up at the bottom of the rise up, and then we’ll go to the Edit account, you could create this as a sub account. And then if we created as a sub account, then if we use that collapse option, this sub accounts will then be collapsed into the parent account. I’m going to close this back out and close this back out.
![]()
4:58
And then we have their refresh items here. So the refresh item will make it so if we make any changes, and we come back, we’re saying what did it did it take the changes happen, we could then refresh the field. Now the settings that we have set up are typically to refresh automatically. So we shouldn’t need this button often. But if you’re if you do not have the settings set up that way, then you would want the refresh settings. And if you’re ever not sure that something took that the change is played out, then you can also also use the refresh button to just make sure that it has taken place, then we have the dates up top. So the dates if we go down, we have the like customized type of date fields, this will be pretty much the same for most reports.
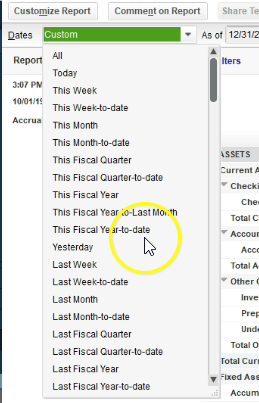
5:40
So it looks kind of intimidating. But if you go through these, it’ll give you kind of the normal kind of items or date ranges we could have it could be today, this week, this week to date this month, this month to date, this fiscal quarter. So oftentimes, we might want to break things out by quarter or by month, this fiscal quarter to date. So we’re going to say the quarter up until this point in time, the current quarter that we are in this fiscal year, which if it’s you’re on a calendar year would be the calendar year, this fiscal year to last month, this fiscal year to date, so the fiscal year up to this point in time.
6:19
Now these are useful even for the balance sheet note notice they’re going to be really useful for like the income statement, of course, because we need a date range to run the report, because that’s what the report will be displaying here and the balance sheet, we only have one one time when date here. However, when we run these date ranges, if we drill down into the detail to the transaction detail, then these ranges become important because that transaction detail is a timing report needing both a beginning and an ending time frame. We have yesterday we have last week, last year, and so on and so forth.
6:53
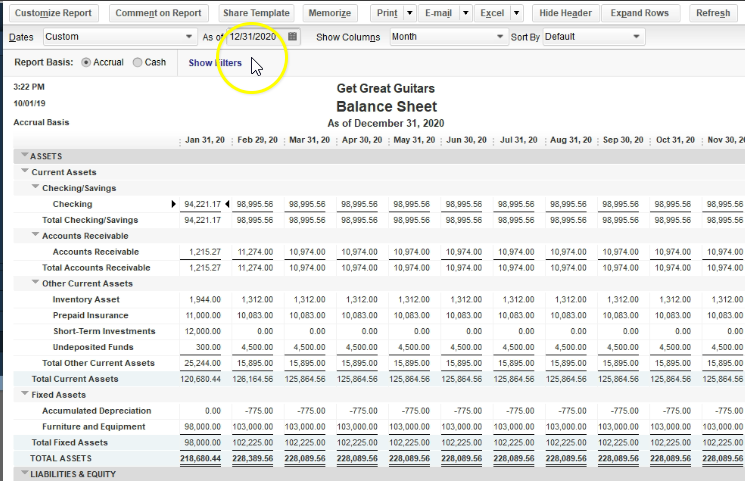
Now if you if you want to then just customize the the time, then you could just put the one date he if you just put one day here note that if I go into the detail using the zoom feature within the balance sheet, then I have no detail because the beginning date is the same as the ending date. So note that it’s really useful to use a range on even on the balance sheet, which is a point in time so that when you go into the transaction detail, by using the zoom feature, you will then have a relevant range that you want to look into, which is a common use of the balance sheet, closing this back out, that’s going to be the dates and then we have the show columns, we can have the total only, and that’s going to be the default for the balance sheet.
7:35
Now, the total column is a little bit deceiving on the balance sheet at least because it’s really only applicable if we adjust the date ranges. So if we only have a point in time right now, then it won’t change anything. As we adjust anything, we will go into the ranges. And we could see the ranges more clearly when we go into the customized report. So we’ll come back to this field. When we go into the customized reports, we have the source by the default, or by the total Do you want to sort by the default settings or by the totals.
8:02
Now when you search by the total settings, it doesn’t mean that you are going to be basically sorting all the accounts on the balance sheet because the balance sheet is in order by assets, liabilities, equity, income and expense and then more detailed by the account types. However, then if you go within the account settings, for example, in other current liabilities, you’ll note that now it’s in order by the amounts, so you got the lowest amount on top, if you wanted to change that you go to a to z. And then you’re going to say the amounts within the account setting for example, here have the highest amount on top. All right, and so that could be a useful way to display that because it’ll have your more kind of relevant information on the top of every category.
8:43
Again, the whole order of the balance sheet is going to be an order by account by account to type assets, liabilities, and then the equity section and then the subcategories of them. And then within those sections, you can then sort in this way by the amount of total, that could be a useful format. If you remove that and you go to the default, then it’ll typically within the the categories be sorting by the alphabetical order.
9:08
So now if you go within the categories, it’s going to it’s going to short generally by the alphabetical order as the default setting. OK, so now I’m going to scroll back up, I’m going to go back to the customized report. Now let’s look at the customized report fields, we’re going to be concentrating here on the display. Note, you have four tabs display filter header, footer fonts, and numbers concentrating here on the display. So up top, we have the same field that we had with the date ranges that we saw before,
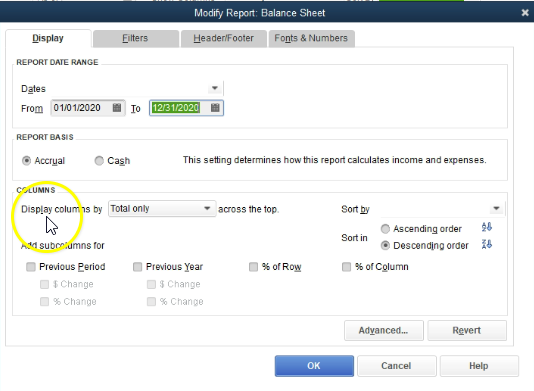
9:35
we could select these date ranges here, or now we have the customized range where we could set a beginning and end date. And if we were to do that, we could say, Oh 10120, for example. And that would give us the entire year. If I say okay, with a date range on the entire year, it does not change the report at all at all. However, if I was to then go into a certain account by double clicking and zooming in into it, it does default now into this new report the transaction detail by account with regards to that date range rather than one day one point in time. That’s very useful.
10:10
So that’s why we want to date range in the balance sheet. closing this back out, we’re going to go back to the customized reports up top. So that’s going to be the date range. And then we have the report basis, which we also have here, I didn’t point that out, we have the basis that we could change from accrual to cash. Now know this could be kind of useful to look into, like if I close this back out, you can change this and and it’ll change everything basically automatically. But it only changes it with regards to how things are set up within QuickBooks.
10:40
Because you’ll note when I get when I went to the cash that in here, it didn’t do anything such as remove the receivables, because it can’t remove the receivables because it’s if the receivables are being driven by how we entered the data into the system. And in other words, if if it was on a complete cash basis, we wouldn’t have accounts receivable because it’s an accrual account. So just note that when you’re going between accrual and cash, you’re not really changing to a complete cash or accrual basis, you’re changing kind of the rules within QuickBooks that it is using to report things like revenue and expenses.
11:16
So in other words, the default setting will be a cruel and I would recommend an accrual setting for most people, unless you have some specific reason to go to the cash basis, even if you are entering data more on a cash basis system. In other words, note that if you go to the to the Home tab here, what what QuickBooks is doing is it saying I’m going to set up revenue when you create an invoice, even though you haven’t collected the cash generally on an accrual basis. And that’s basically just simply the way the system is going to be set up. Now notice that doesn’t mean that that’s completely right every time because I could have entered this invoice after I did the work far after I did the work. So it’s still not a perfect system.
11:59
QuickBooks just needs to be able to define when to record the cash at some point in time. And if you if you have the default accrual settings, it’s going to use the invoice in order to do that. So just note that the way you enter this stuff into the system is still going to drive whether you’re on a cash or accrual basis, if you if you simply take everything from a bank statement, for example, and internet directly into the check register. At the point in time it clears the bank, then you’re on more of a cash basis because you’re entering the data on on a cash basis by tape by only recording the cash transactions that are coming from the bank in the system.
12:35
And in that case, if you go back to the balance sheet and you select a cruel, it doesn’t mean you’re necessarily on a cruel, it’s just because you entered everything on a cash basis. And so you’re not really on an accrual system there. So just note that these two settings are going to kind of adjust when QuickBooks will determine when to record revenue and expenses according to the rules of the system. But it doesn’t automatically make you make everything to a cash basis because it also depends on how you enter things into the QuickBooks system. So I would I would recommend keeping the default on the accrual settings, even if you enter things more on a on a cash basis generally. And then we’re going to go down to the columns, we got the display columns, these will now be relevant
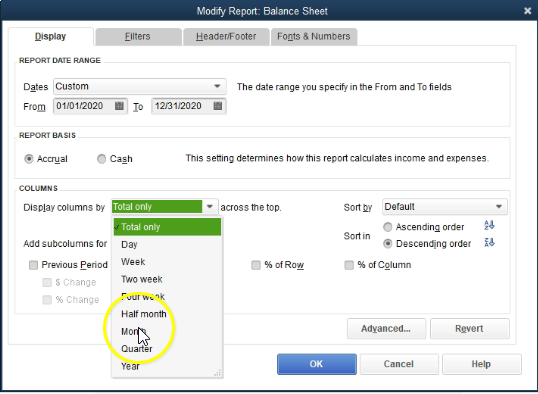
13:17
given the fact that we have a range here. So now if I was to choose some other option here, say I was to choose a month, and then say, Okay, now because we have the range up top, not just this single date will have January, February, and so on. Now note, this is as of the month end, for each of these dates, the month end of January, month into February, and so on and so forth, we only have two months of data. So everything after February is going to be the same, because there’s no change there.
13:45
Let’s go back up top into the customized reports. So we’ve just looked at the month, we’d have the sort options, the sorting options we saw up top. So we’ve also we’ve already seen the sorting options. If we then go down to the add the sub columns, we have the previous time period. Now this would be an item like what if we wanted to see one month compared to another month, we can see it already here by using the month option. That’s one way we can do this. For example, if I change the second date here, 202 29 to zero, so then we have the two month time period and where to say okay, then we have our comparison, we have the January and February. That’s one way we can do the comparison.
14:28
Another way we can do it and we can we can go to the customized reports up top, we can go down here and say I would like to see the previous period. Now this is a little bit tricky to wrap your head around. Because what does that mean the previous period? Well, that means that will we must be talking about one month period and then take the previous period to it. So for example, if I was to change the beginning date of top 202 or 12020 229, or to the end of the month, then the one month time period, then if I was to take the previous period to it and say okay, then we have February and January.
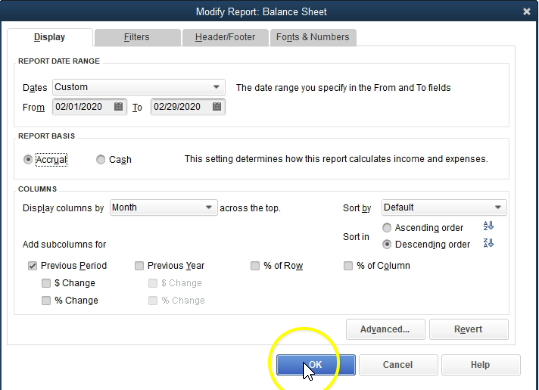
15:09
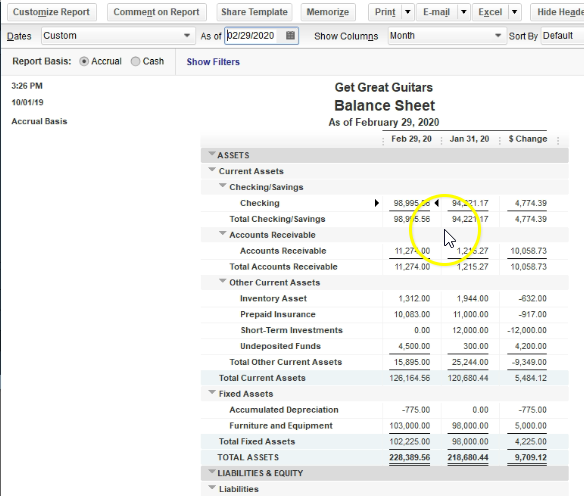
Notice what’s happened here is it actually put the current month first, which is nice, right it put the current month, month first, and then put the prior month. So it might be a little confusing to read that at first. But that is kind of nice to have that because they will put the most current data, we’re reading the most current data from left to right, as opposed to reading the oldest data first, then if we go to the customized reports up top, we can also add the change in terms of dollar amount of change, and say okay, and that’ll give us our change here. So now we’ve got the difference between the two.
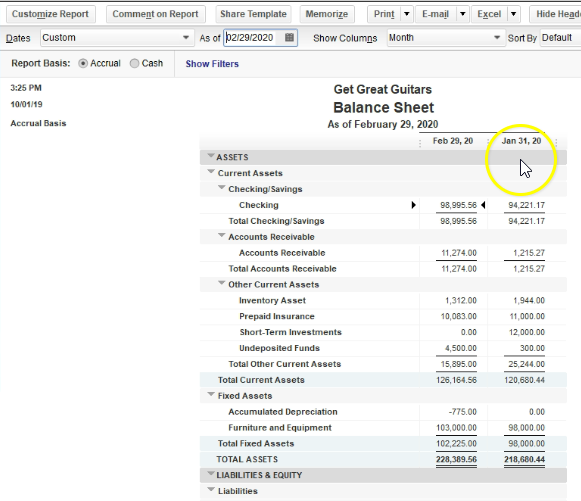
15:45
Of course, if we took the 98 995 56 minus the 94 221 17, we get our change, then we also have if we go to the customized reports, the percentage change selecting the personal percentage change, we then get the percentage change. Now what does this look like? Well, if we pulled out our trusty calculator here, what we’re saying for example, with cash, we have the 90 899 5.56 minus the 9422 1.17, that’s going to be our change 477 4.39. If we take that change and divide by the previous year, that the oldest number that 9422 1.17, and we move the decimal over to places, that’s going to be 5.1 5.1%. So that’s the percentage change, in this case, the percentage increase. So it went up by 5.1%.
16:41
These are going to be really, really useful if we want to make comparisons to other type of companies that have different dollar amounts to us. But the change should be relevant. So this is anytime you want to measure something against someone some other set of numbers, some others financial statement, in this case, or any kind of measuring thing, these ratios are going to be really useful to do. Let’s do it one more time, let’s do it with the this one, the inventory, it went down 32%. So we have a as a 1312 minus 21944.
17:13
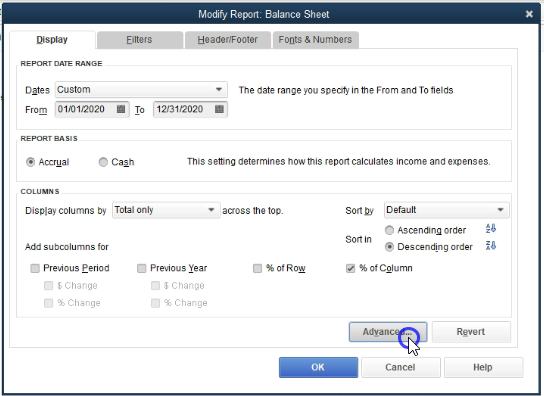
That’s a change or decrease of the 632. If I take that and divide it by the original number, one nine out for four, we get the if I move the decimal point over two places, a decrease of 32.5%. If we go back into the customized report, we have similar options for the previous year. So we can do a similar type of setup for the previous year, I’m going to uncheck now the previous period, then we have the two options over here, which is the percentage of row and percentage of column, let’s change our dates up top once again to a 10120 to 1230 120. For the year, January through December, we’re going to sit then select the percentage of row. And OK, so the percentage of and note I didn’t change the month, so I’m going to change the months now I’m going to select the month drop down, and I’m going to go to simply the total such as the total. And then we have the percentage of row here not very useful when we only have the one column. So if

18:14
we go back to the month up top, then we’ll have some change in the percentage of rows. Let’s take a look at the last one, we’re going to go to the customized reports one more time, we’re going to then uncheck the percentage of rows and take a look at the percentage of columns. And then I’m going to go back for a month to the total columns. And then we’re going to say okay, and then we’ve got the percentage of the columns.
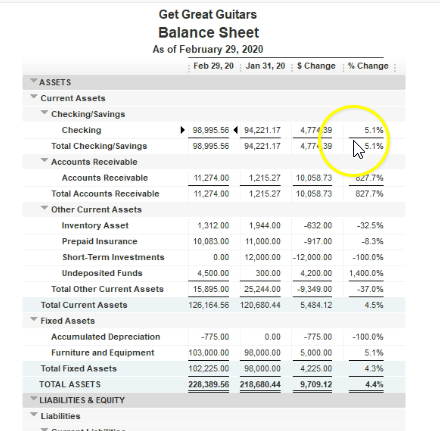
18:36
Now when you think about the percentage of the columns, if it’s time out of it, you can think of it the most relevant number within the column. In this case, we’re talking about the total assets. So the total assets is down here, that’s 100%. we’re comparing everything else to those total assets. So for example, if we’re thinking about cash, we’ve got the 9899 5.56 divided by the total, which is the 889, point five, six, something went wrong there. Let’s do that one more time, we’ve got the 9899 5.56 divided by not mine is the two to 8098 9.56, we then get if we move the decimal two places over 43.4%. So cash, then it’s 43.4% of the total assets.
19:24
This kind of comparison is really useful if you again, if you’re comparing to another company that has different amount of total assets, maybe they have more or less money, but you want to compare the ratios, the ratio comparison then can give you value that you couldn’t get, if you just if you just simply compare the dollar amounts, so then you can compare to someone that’s like a publicly traded company possibly. And that has a lot more money in total. But the ratios can give you some value.
19:49
When you do those comparisons, similar kind of thing down here on the liabilities and equity, the bottom line, of course being liabilities and equity, you can then compare then the accounts receivable and so on and so forth to the total liabilities and equity, we’re going to go back into the customized reports up top, we have some advanced settings. So if we go into the advanced settings, we’ve got display out rows, we can display the items that are active, or we can display all of them, or we can display the non zeros.
20:18
So active means that basically if there was if even if it was zero, but there was something that happened in that particular account, it’ll show the zero, which is kind of nice, because then you can go into it and double click on it and zoom into that account and see the detail in it. If you look at all of them, then it’s going to be showing in the case of the balance sheet all accounts even if there’s no activity in them. So for example, if we said, okay, and Okay, then you’ll notice we have a lot of accounts that don’t have any activity, a lot of zero accounts. And even if I double click on them, they have no activity here.
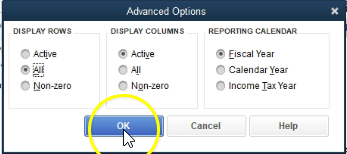
20:53
So there’s no real use for them on this report, except to just know that they’re going to be in you know, the chart of accounts beta, basically balance sheet type of accounts. So if we go back to the customized reports, advanced settings, you probably want yours on the active or the the non zero accounts, display columns, we want the active or you can have all columns or the non zero columns in a column format, and the reporting calendar.
21:20
So obviously, the default here is going to be the active and then the reporting calendar, the fiscal year, the calendar year, the income tax year, at Now, typically for a lot of companies, they’ll be the same thing. The fiscal year will be 1231, the calendar year will be 1231 year end, but if there’s any changes then you can choose those items that which will adjust those we can say okay, and then of course we have the Robert so if I was going to revert back to the to the prior settings, it’ll revert back I’ll then change the dates because I don’t want to revert the dates back. And I’m going to go say, Oh 10120 to 1230 120 and then Okay, and then we’re back to our standard setting.