
0:00
In this presentation, we will create a custom competitive balance sheet report, we will create it from a balance sheet standard type of report. Once created, we will then print it as a PDF file and export it to excel, we will be doing this within QuickBooks Pro 2020, QuickBooks desktop 2020.
0:20
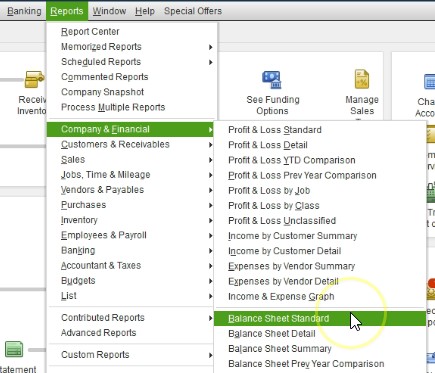
Here is our get great guitars file we currently have the open windows open, you can open the open windows by going to the view drop down and selecting the open windows list. We’re going to start off by creating a balance sheet a standard report generating a balance sheet standard report we will do so with the reports drop down Up top will go to the company and financial we’re going to scroll down to our familiar and our favorites and balance sheet standard report.
0:44
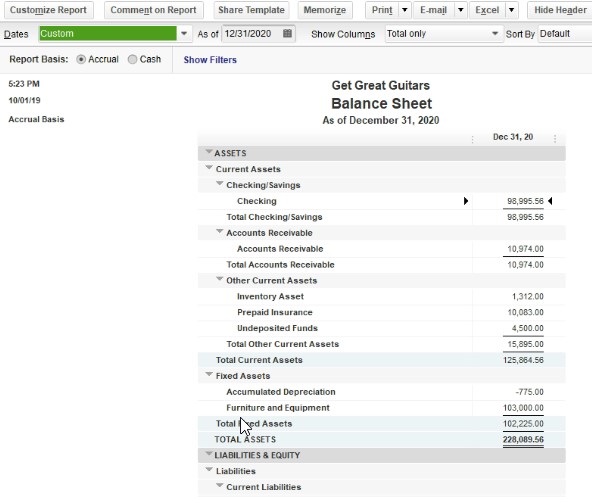
Before I click on it, however, just note that we do have a balance sheet of previous year comparison, if it was a year to year comparison that we can do, we’re going to be doing a month to month comparison, we’re going to be altering the standard balance sheet report. And as we do so we’ll get used to the flow for altering airport. So we’re going to go to the balance sheet standard report. Here is our standard report, we’re going to change the dates, I like to change the dates up top in the customized reports. So I can choose the relevant field that I would like the range. So from a one on one to zero to 1231 to zero, that’s January through December 2020.
1:20
Now we’ve looked at a few of these options we were gonna we were going to use now in a previous presentation, when we looked at the options for the customizing the reports, now we’re going to apply that customization option to make it a competitive balance sheet, what we want to end up with is a comparison of January in February of 2020, we’re also going to have the change and the percentage change involved in it, then we’ll do some further customization to it, including removing the pennies and removing these items over here and adjusting the heading. So that is no longer simply a balance sheet as of this date, but a comparative balance sheet, and therefore we need to change the date and the title.
2:04
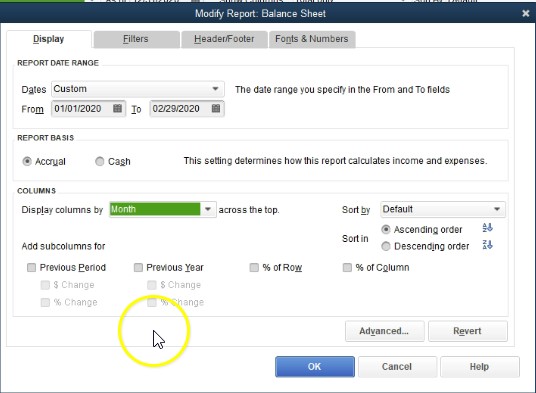
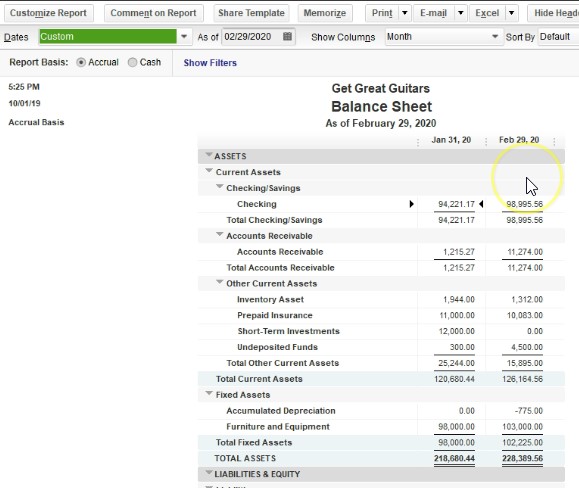
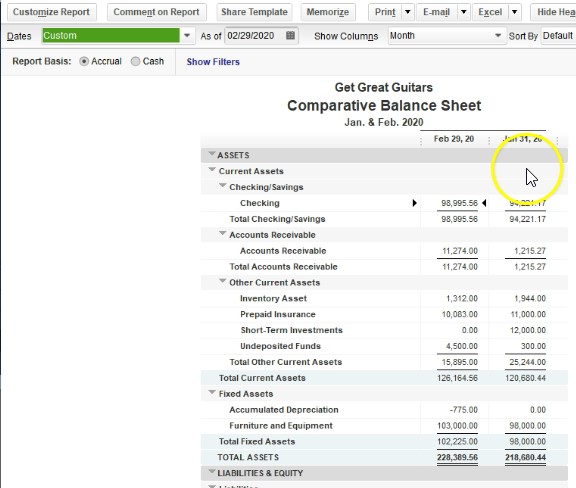
So to do that, let’s start off with a comparison, we’re going to go up top to the customized reports, we’re then going to be in the display options, a couple different ways that we can do a comparison, our goal, our objectives, recall is to have January in February, two months, that comparative of two months, January in February. So we could then say let’s try Let’s choose the date range and make it to the correct date range, right, we could say let’s make the in day 202 29 to zero, there’s 29 days in 2020. And then let’s go down and change the display columns to the months in by doing just a month, then it’ll pick up those two months. So I’m going to say okay, and there we have it and January in February.
2:47
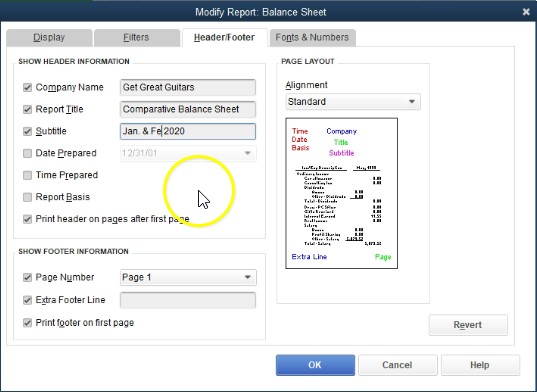
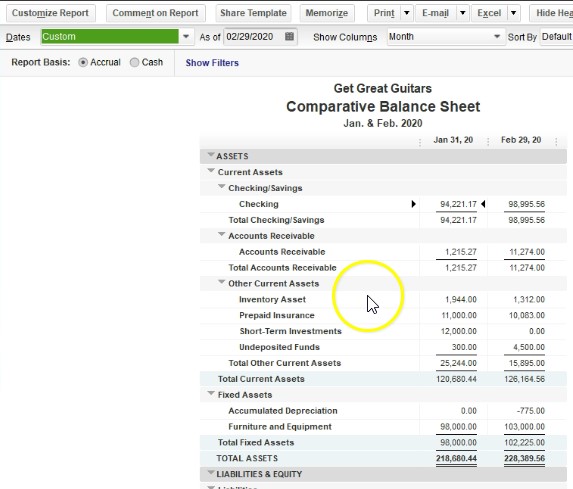
So that’s one way we can do kind of a comparison. Once that is done, then we would want to go up top and adjust the title. So we’d want to adjust the title and when the date is now wrong. And oftentimes we want it then because the date should January February, not as of one point time as a February 3 29th. And we can remove these items here. So we’re going to go up to the customized reports, we’re going to go to the header and footer. And I would typically remove the date prepared the time prepared that report basis. And if we select OK, we have not removed these items, then I’ll change the title, we’re going to go to Customize reports. We’re going to go then to the header and footer. And we’re going to change this to I’m just going to add before the balance sheet and the report a comparative balance sheet. And then for the dates, I’m going to say January in February. So let’s say,
3:44
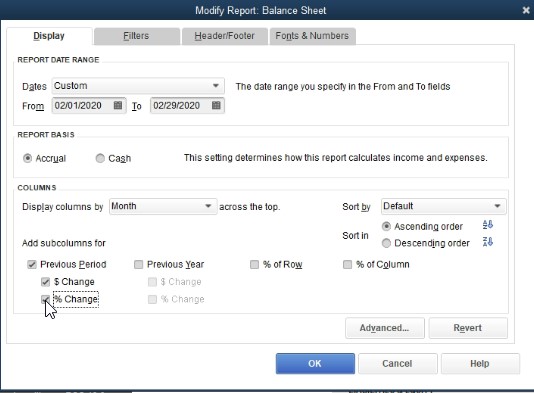
Jen, let’s just abbreviate January, and February, and 2020. And then if I say okay, then we can have a more customized report up top in terms of that if I go to the customized options, again, the other way that we can with this, if I go back to the display options, if I want to see a comparison, and then the difference or change between the two months, you’ll recall that’s going to be with these previous options down here.
4:12
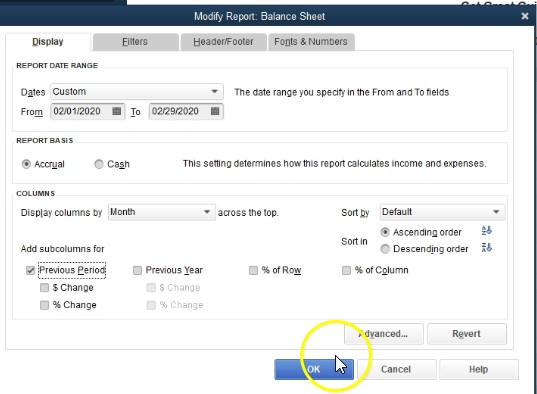
So instead of basically using the month as the factor that will be used, I’m going to go back up top and go back to the total. And then actually, we could keep it on the month, I’ll keep it on the month. And then I want to use the previous month someone that means that I have to be in the current month, not the full date range, not the two month date range, but just the first of the second month, oh one to zero.
4:36
So February 1 through February 29, just the second month, I’m going to keep the months down here instead of the total. Because if I have the totals, then it may not pick up the fact that I’m talking about a month in that in that case, it’ll it’ll, it could throw things off, if given the fact that the month don’t have the same amount of days in them. So if I select a range that is 30 days in the next month is less than 30 days, then it could mess up the range. So therefore I will keep this on the month. And then I want to have the previous period, which QuickBooks should read then as the previous month, not the previous 29 days. So if we select that, then note what will happen on the change here, we had January 1, then February, this is a way that we can have a similar report, but February 1, so I’d say okay, we have February and then January.
5:29
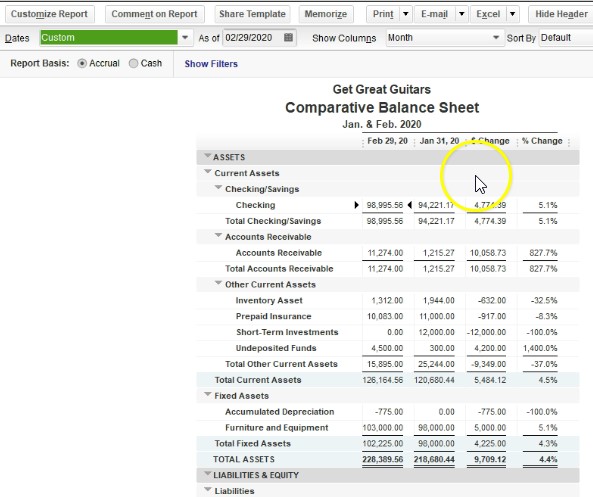
This is a common way to see the report. Because oftentimes, if someone’s glancing at a report really quickly, they’re going to say what’s most important, the recent data, and that’s what they want first, possibly, and then if they have time, they’re going to go to the prior data, which is going to be to the right, so they can read left to right. And this way important to less important. Back to the customized reports, we will be adding the change in dollars and change in percent, as we’ve seen in a prior presentation. So we’re going to say Okay, so then we have it, this is what we have so far. So and we’ve seen these change in dollars and change and percent in a prior presentation.
6:07
So I won’t spend a lot of time on it. But just note, of course, we’re talking about the change between the columns from one year to it from one period to the next. And this case, from February in January. Notice we are taking on the entire month in this case. And so the the number of days then is not exactly even because we’re taking on the entire month. And then we have the percentage change the percentage increase and decrease very valuable column. When we’re comparing to other things like other companies to see what how they’re progressing. The percentage change is very useful in those cases.
6:41
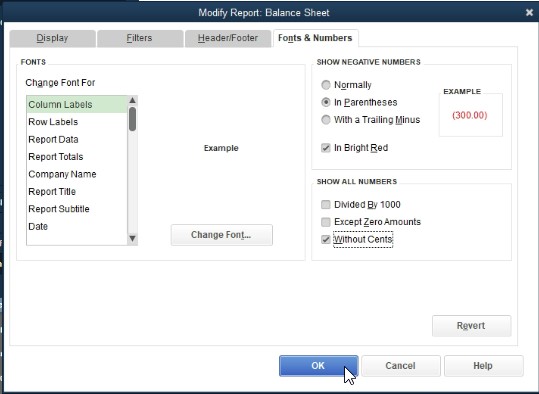
Let’s go back and make a few other adjustments, I’m going to remove the pennies, we don’t really need the pennies in the report. So I’m going to take those out, I’m going to go back up to the customized reports up top, I’m going to go to the fonts and numbers within the fonts and numbers, I’m going to display the next it is with parentheses, I’m going to make them read. So make them read, then I’m going to remove the sense going to remove the penny. So we no longer have to see the pennies. And that should clean this up a bit. If we close this out, I’m going to say save.
7:15
There we have it. So now it’s a little bit a little bit nicer or easier to look at the pennies aren’t adding a lot of value with the with the analyzing of the reports. And then we scrolling down this is what we have so far, this is what it looks like at this point. Now this is a new report we haven’t generated yet. Therefore, I’m going to go ahead and save this in our section one folder. So I’m going to save it in a couple different ways. I’m going to save it first as a PDF file, and then we’ll save it as to the Excel document that we can then use to create another PDF file with multiple documents within it. So I’m going to go ahead and save this.

7:50
And we’ll go to I use the print up top, I’m going to use the cute PDF printer. So I’m going to print it to the cute PDF printer, which is going to be making it printing or a PDF file as opposed to printing it to an actual printer. And I’m going to say print. And then it’ll give us the printing options. Note Of course, you don’t need the cute PDF printer do this, you could save it as a PDF. But I think it’s good practice to use this cute PDF printer, or some other type of PDF printer. I’m not advertising that particular one. But something that has a PDF printer for it can be useful. I’m going to then go to the desktop.
8:29
And we will find our folder get great guitars, we’re going to put this into section one. And then I like to be able to just align this right under the title. And say that this is going to be the I’ll just abbreviate it a bit comparative balance sheet. And I’ll say Jan, and fed 2020. So we’ll save that, I’ll save that. And then I’m going to export it, I’m going to export it to an Excel file that we have already set up previous in this section.
9:05
So I’m going to export it to an existing Excel file. If you haven’t seen the existing Excel file, you can export it to a new worksheet if you so choose, if you want to follow along, I’m going to go to the export f stop or Excel up top and then go to create a new Excel worksheet. It’ll be a new worksheet, but the in the existing workbook. So here I want to put it to an existing workbook that we have created in a prior presentation. So if you don’t have another workbook, you can just create a new workbook here. And then we can go to browse. And this is the one I want, I believe, let’s just double check that. Yeah, I think that’s it, we’re going to say, Actually, let me browse here, I’m going to go to the desktop, I’m going to go to get great guitars is where I bought it, I put it into section one.
9:50
And then I’m going to say that I want this report here. So I’m going to choose this financial statement 2020, double click on it, and then export to it. So here we have it, we have our similar kind of quirky things that Excel does one, it adds the sheet to the front, I’m going to go on that sheet, I’m going to right click on that tab and delete it. So I’ll remove that tab, then I’m going to go back on the sheet one, this is where they put it, I would like to have this all the way to the right. So I’m going to go ahead and grab it, I’m going to left click on it and grab it and drag it to the right.
10:22
So there we have it, I’m going to remove the split pains, I will typically do this by going to the layout page layout, which is this little icon to the bottom right. And today, okay. And then there’s our splits, we can see them clearly now. So I’m going to go up top to the View tab, the windows group, remove the splits. And there we have that I like to then add the title will I can see the title of top in this view. So I’ll double click on the sheet tab or add the tab title to the tab, which is going to be I’m going to say comparative balance sheet, and let’s say 2020. And then I’ll say back into here, then I’ll go back to the normal view.
11:00
There we have that. So it should look it all fits on one page. It’s a little it’s more than one page long, but it’s okay and one page wide. So I’m okay with that. I’m then going to export this entire worksheet, which includes a balance sheet a profit and loss, p&l, and now the comparative balance sheet to one report. So we’re going to do that by going to the File tab up top, I’m going to say print, I’m going to print it to RQ to PDF printer, and I’m going to print the entire workbook. So then I’m going to print the entire workbook using the cute PDF printer. And then you can see down here we’ve got the preview.
11:37
This is what it looks like all this detail in one workbook, I’m going to then go ahead and print it. And it will then give us the printing option. Now I’m going to save it over this one, I’ve already got it there, I’m going to save it over that one. So I’m going to say save with the same name, replace what I currently have. So this is what we have here we’ve got the financial 2020. If I open out that report, then it’ll include the new one that we have. We’ve got then the balance sheet, we’ve got then the profit and loss report. And we’ve got the comparative balance sheet all in one report.
12:12
This then is something that we can upload or give to someone else in a fairly easy fashion. If we close this back out, that would be easier than if I take I’m going to take this report and I’m going to drag it into our financial reports. Now you can see our financial reports are getting a but a bit longer. And these can get quite substantially long depending on how much detail we want to give to somebody as of the end of the month or the end of the period. And so therefore, we could zip this file, we can attach these three documents, or we can create a zip file with those documents in it. So if I was to just say, okay, we added one, I’m going to delete the zip file, right click on it and create another one. That means we can attach this zip file to an email or we can simply attach this one PDF file that has everything in it which we created through the export into Excel and then the creation of that PDF file.