

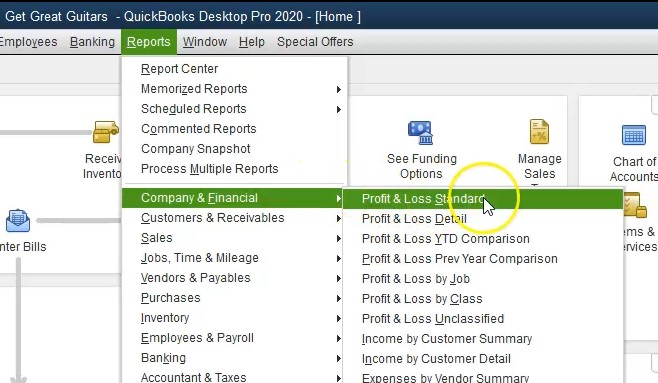
In this presentation, we will create a comparative a profit and loss report from a profit and loss standard report within QuickBooks Pro 2020, QuickBooks desktop 2020. Here we are in our get great guitars file, we currently have the open windows open, you can open the open windows by selecting the view drop down up top and go into the open that windows that list, we’re going to be starting off with the profit and loss standard report, we will then go to the reports drop down Up top to open that up and go to our favorite report one of the two favorite reports being the profit and loss standard in the company and financials within will change the dates up top the dates are from a one a 120 to 1230 120.
0:43
This is going to be the report we’ve been working with thus far, we’re going to now do a comparative profit and loss. And we’re going to be comparing simply the January and the February rather than the entire year. So we want to compare January and February. The first thing we can try then is to adjust the date range from January to February. So January 202 29 to zero is going to be 29 days in February 2020. So if we have that, then you can see that it doesn’t do a comparison, what this will do is create a profit and loss reports for a two month time period both January and February.
1:18
Recall that the profit and loss report means that we’re going to be entering data for a time period it needs a beginning and an end. In other words, in other words, it’s going to tell us how we did over some period of time. Therefore if we select two months of a time of range, it’s going to tell us how we did over that two month time period. In other words, income will be accumulating upward for the two month time period as well as expenses. And the net income will be the difference of the two. Now the one way that we can think about well, how can we break this out, because what I really want to see is how we did for the month of January, that accumulation of January 1 through this January 31.
1:56
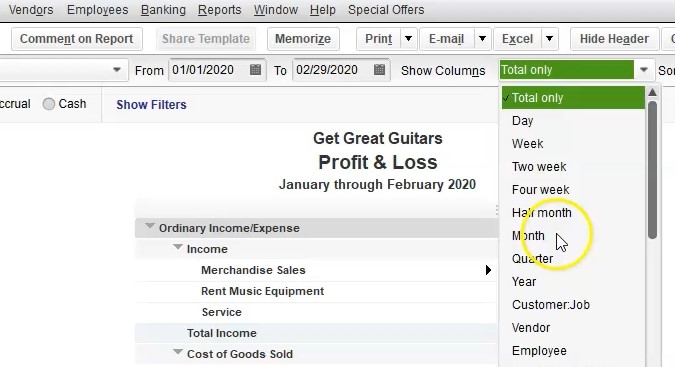
And then February, February 1 through February 29. One way we can do that is we can go to this drop down here. And we want to say let’s go down two months. So if I change that two months, now we’ve got January in February, and then the total, notice that it now gives us the total as it was not given in the balance sheet. Because the balance sheet is as of a point in time, if I ran the same report for the balance sheet, we wouldn’t have a total column because we wouldn’t be adding up the two time periods because it would be as of the end of January, as of the end of February.
2:29
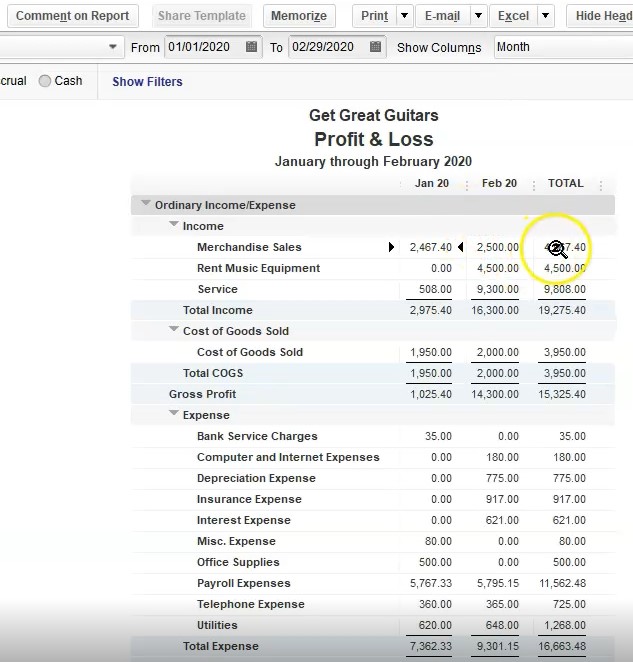
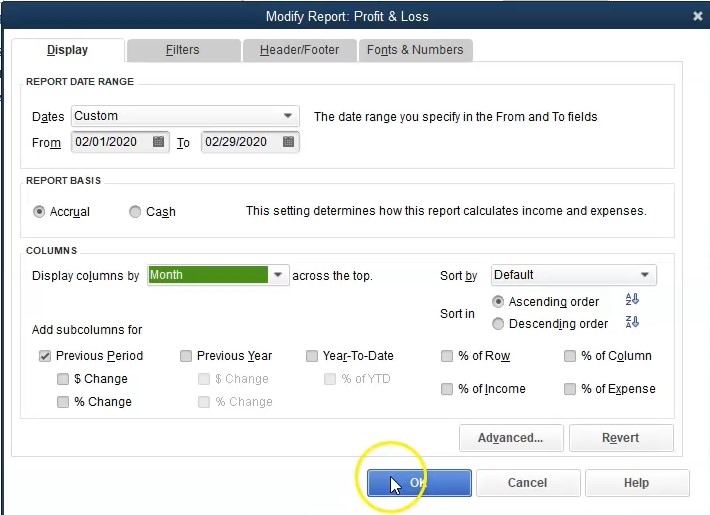
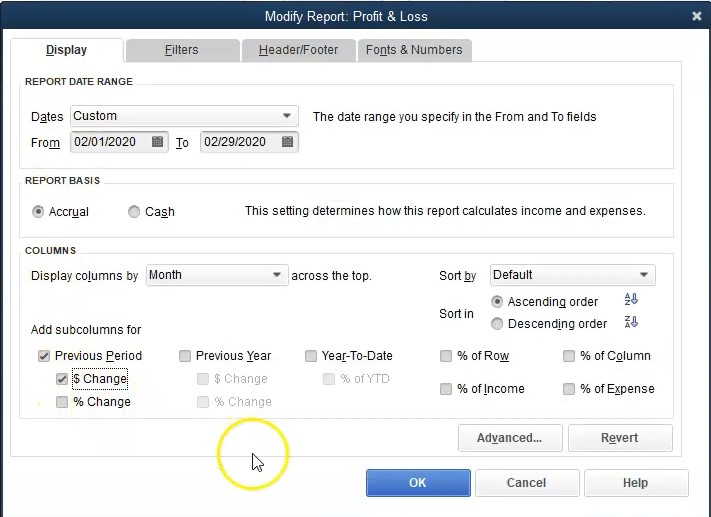
The end of February is the total as of the end of February. As of that point in time here. However, we’re saying how much did we accumulate in revenue upwards? In January? How much did we accumulate upwards in February? And then how much did we accumulate between both January and February giving us then the total. So this is one way that we can see this? Obviously, we have the January 1, and then February we’re reading left to right, oldest to newest. And so what how else can we see this, we can go up top into the customized reports up top, we can also say Well, why don’t I want to use this previous item here, as we saw on the balance sheet. If I want to use the previous period format, then what I need to do then is select just the current month. So I want to select the current month, which is going to be Oh 20120.
3:20
Now note that you want to keep it on months down here as well, because if you were to change it to totals, then it might see this just as basically 29 days, and I would like to have it for the month. And notice this could be a little bit tricky, a little bit different. When you go to the QuickBooks Online to buy they’ll have the similar kind of format for it. So I typically keep it with a month then. And then I want to look at the previous period.
3:43
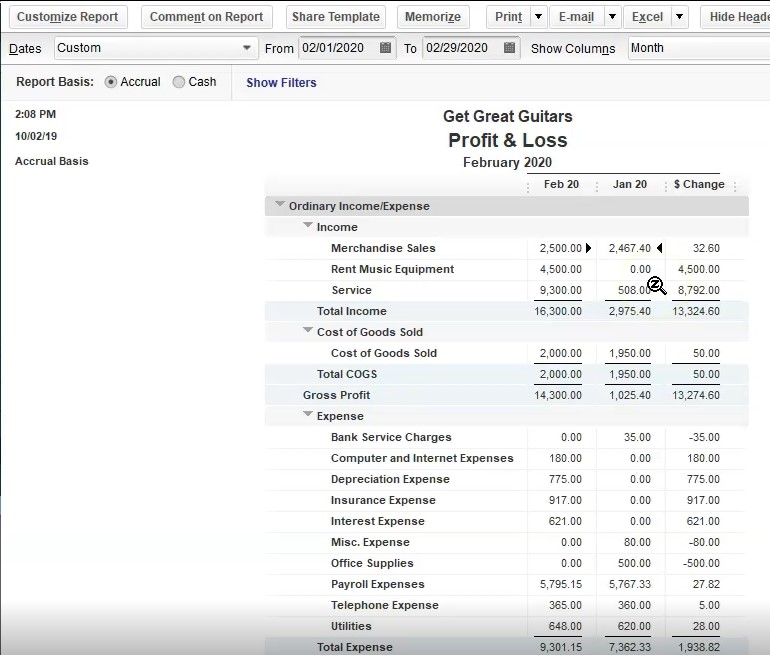
So we’re going to select a month, the previous periods were in the current of the second month, then we want the previous month, which would be January, we’re going to then say okay, and you’ll see now then it does the same thing. However, this time, it puts February 1 and then January. So now we have February and vengeance worry, we don’t have the total column. So that’s going to be the major difference on the profit loss type report. If you want the total column, if you want January in February, and then the total summing them up between the two, then you can use basically just simply the months calm.

4:15
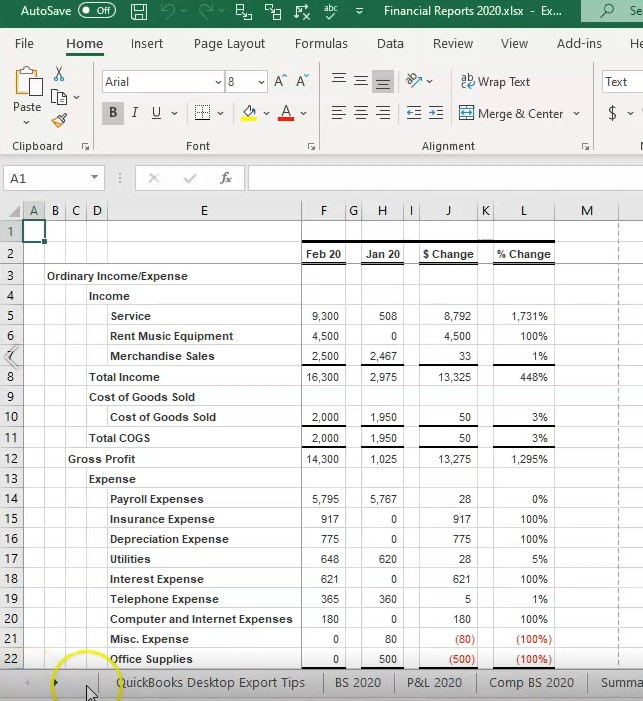
If you want then the other the current month first, and instead of the total, the difference between the two, how they did between them, then we can go to the customized reports and say I would like to see the dollar change, and then say, Okay, so now what we have, instead of it totaling up the performance over the two month time period, it’s comparing and contrasting how we did in the one month to the other month.
4:40
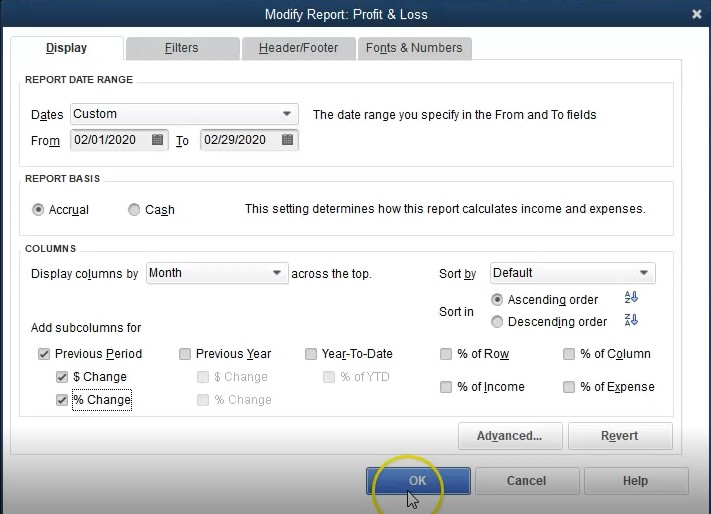
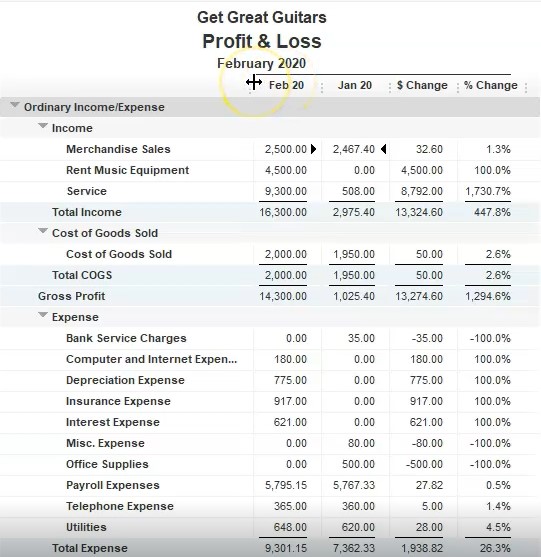
And so obviously the change is the difference. And we can compare out how we did from one to the other, then we can also have the percentage change by going up to the customized reports up top, we then wanted to take a look at the percentage change percentage change and say, Okay, so now we have the percentage change. If we were then to consider percentage change, it could be a little confusing to think about the percentage change, it’s just going to be the for example, if I took the total income, the 1630 minus the 297 5.4, that’s the dollar change, we’re going to take that change and divide by the previous month, in this case, January of 297 5.4. Now if I move the decimal two places over, that’s going to be a 447.8 increase, which is a pretty nice increase, but it’s the first year of operation. So funny things happen in the first year of operation. So that’s good.
5:36
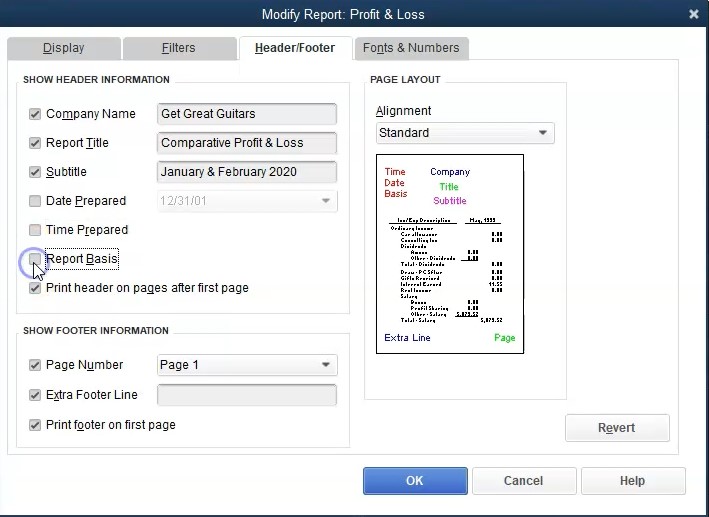
That’s how you’re going to calculate the increase and the decrease. Now we’re going to do some formatting with this. Now, you’ll note of course, is not just a profit and loss will not going to call it a comparative profit and loss. It’s not simply for the month of February, but now January and February. So let’s change those items. And I’m also going to remove these these items up top.
5:56
So we’re going to go to the customized reports, headers and footers, we’re going to say that we want this to be a profit and loss, let’s just call it a comparative comparative profit loss. You could call it a comparative income statement, if you think that the readers of your financial statements would prefer that terminology. And then we’re going to say January and February 2002, and 20, then we’ll remove the date prepared time prepared and reports basis, that will remove these three items, then I’m going to add the footer, which I’m just going to call Smith, CPA, that’s going to let the name of our firm will put on the footer, and then we’ll say okay, then if I was to see that footer, we can go to the print option up top and report, then preview. And then here’s our footer down below.
6:48
If I zoom in there, there’s the footer, I can close it out here, I can close it out up top here. And then I’m going to close this back out. Now I’m going to do a little bit more formatting, I’m going to remove the pennies on it, we’re going to make those negative no red. And with brackets as opposed to just the dash, we’re going to do that by going up to the customized reports up top, we’re going to go to the fonts and numbers, we’re then going to change the parentheses here, we’re going to make them read if the negative number, we’re going to remove the pennies, and then I’ll say, okay, so that cleans it up a little bit, we got the red numbers in there, we have removed the pennies for it, then I’m also going to change within the categories to have the highest number of top in the category.

7:31
So I would go to the sort by, I want to have the totals. And then I want to put this in descending order. So totals a down to z. Now within the expenses, we have the descending order here. So this is what it looks like so far. Now I’m going to go ahead and memorize this report. So we can put this into our memorized report. So we’re going to go then to memorize. And then we’re going to put this into the it’s called the comparative profit and loss that looks good. We’re going to put it into save in memorize, I’m going to put this into our custom location, which is going to be in the my Reports

8:06
section within my reports. And then, okay, yeah, it takes a little picture, if you have the audio on it, I’m going to close it out and then open it back up within my reports in the memorized reports, closing it out here. We’re then going to go to the reports up top, we’re going to go to the memorized reports. And then we want to go to my reports, which in this case, now we’re looking for the brought the comparative profit and loss. Here it is comparative profit and loss, we’re going to open that one up, there it is.

8:35
Now we’re going to go ahead and save this in a couple of different formats. We’re going to save it as a PDF file. And we’re going to print it to we’re going to save it in our Excel document that we have been creating for all the reports. And then we’ll use that to create one PDF file with all all of the reports we’ve created thus far. So to do that, we’re going to go up top, we’re going to go to print. This time, instead of printing using the cute PDF printer, I’m simply going to go to save as PDF. So we’ll save as PDF, it’ll then open up here, I like to put this right under the name. So I can just go to it and put the name down below. And the name is going to be a comparative, I’m just gonna say comparative, P and L. Just going to go 2020. And so I’m going to save that, then we’re going to export it.

9:26
So I’m going to export it up top to create a new worksheet to the new worksheet, it’s going to go to an existing workbook, if you don’t have a workbook open, you can just create a new one here, but I’m going to go to the existing workbook we’ve been working on, we will browse to locate that workbook, it’s going right where we want it because we’ve been going there a lot lately. So we’re going to go into the financial reports 2020, double click on that and export to it. Here we have it, we got the same kind of weird stuff going on that we got to clean up within Excel.

9:56
So I’m going to go all the way to the left one, it’s going to be this new tab, I’m going to get get rid of his new tab by clicking on it right clicking on it, and then deleting it, so will delete that tab, then I’m going to go back on sheet one, I’m going to drag it to the right because it kind of put it in the middle here and I’d like to put it to the right, so I’m going to left click on that sheet, drag it to the right, then we’re going to do the cleaning up of the split pains.
10:21
We’re going to do that by going to the page layout to view I’m going to click on the Page Layout View, I’m going to say okay, then we can see the splits here, I’d like to get rid of those going to do that by going to the View tab up top, we’re going to go into the windows group, we’re going to split the pains and split the pains please. And then we’re going to rename it while we can see the name up top. So the name is going to be if I double click on the tab down below, it’s going to be a comparative P and L compare the P and L, I’m going to go back to the normal view.
10:52
Now back to the normal view. Now we’re going to save this document with all of these files located within it. So all of these files, were want to save them all in one PDF file that we can then send to someone. So we’re going to go back up top or and go to the File tab, we’re going to go to the print option. We’re then going to say I want to print the entire workbook, not just this worksheet, but the entire workbook, we have the entire workbook. And then we see we have seven pages.
11:18
These are the seven pages as we scroll through them. They all look Excellent. So now we’re going to go ahead and export this, I typically would use the cute PDF printer, I’m going to select the drop down up top, go to the cute PDF printer, and then I’m going to print it. So we’re going to print it, it’ll then give us our option to locate where we want to put it minds can be in Section four, I want to overwrite this financial report right there. So I’m just going to say Save to that. Yes, and it’s going to overwrite that report, then we can take a look at what it looks like. So I’m going to open it back up. And here we have it, we’re going to be in second one through four.
12:02
This is how we can provide this information to a client supervisor or our sales or whatever we have within the financial, we could give all of these saved as PDF files, which is given kind of tedious. You can imagine the filter all attached to an email to you that you can kind of like adds a lot of lot of stuff. I don’t know if I want to open it. And then we have the we could zip it so that we could say okay, well here’s at least zip I’m going to right click and zip it. So that we provide just that zip file attached, that could be a little nicer. Or we can give the Excel file if someone is okay with an Excel file, or we can get this PDF file that we created from the Excel file which has all the reports to it, which at least would be easier to have one attachment right so we got the the balance sheet we got the profit and loss that we created.
12:51
We’ve got the competitive balance sheet. Now we’ve got the end of the comparative balance sheet, we got the summary balance sheet, we’ve got the income statement, we’ve got now the comparative Profit and Loss report. We can provide all that with one document in this format.