
In this presentation, we will create a vertical analysis Profit and Loss report from a profit and loss standard report, we will be doing this in QuickBooks Pro 2020, QuickBooks desktop 2020. Here we are in our get great guitars file, we currently have the open windows open, you can open the open windows by selecting the view drop down and the open windows lyst.
0:21
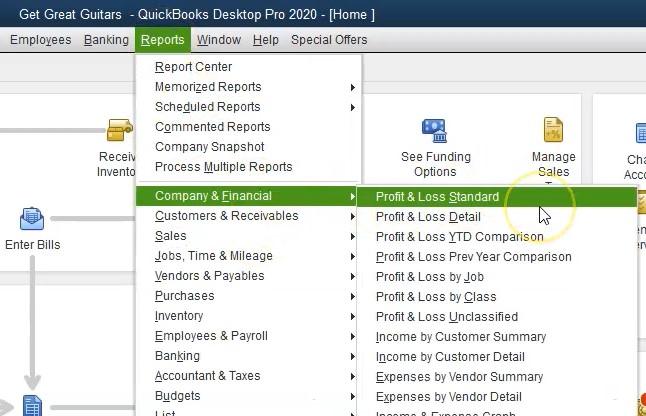
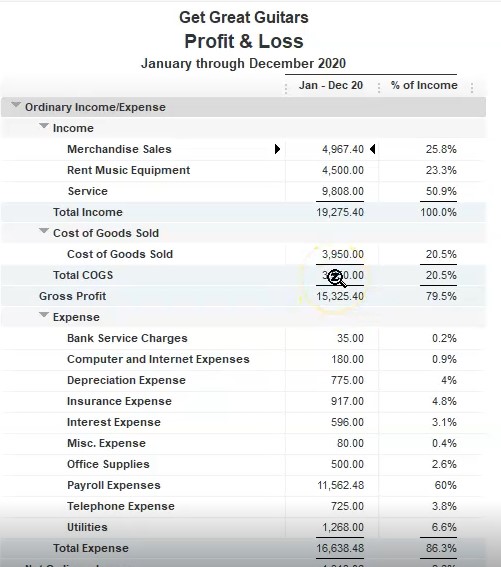
We’re now going to be creating our profit and loss of standard report by selecting member reports top down Up top going to the company and financial and then the profit and loss of standard report. Within the profit and loss standard, we’re going to be changing the dates from a 10120 to 1230 120. That’s January through December 2020. This is our starting point. Our major goal here is to make a vertical analysis adding another column which will in essence be comparing every line item to the income line.
0:53
The reason you would want to do this is because the income you can think of it’s basically the goal of the organization, the goal or the main number on the profit and loss report. That’s what the company is trying to do generate revenue. All other things, including expenses are there in order to help us to generate revenue. So therefore it can be useful for us to think of all other items as they are related to the income item or the revenue item.
1:19
This is also something that will be very useful to us if we want to benchmark or compare to other types of companies, companies that may have different dollar amounts. In other words, they might be a much larger company that we want to benchmark to, we can’t do so with the numbers in straight dollar amounts, because they won’t be something that is comparable to us, then we won’t be able to draw information from that however, we may be able to use this percentage kind of format, in order for us to draw information help us to benchmark to other types of organizations.
1:50
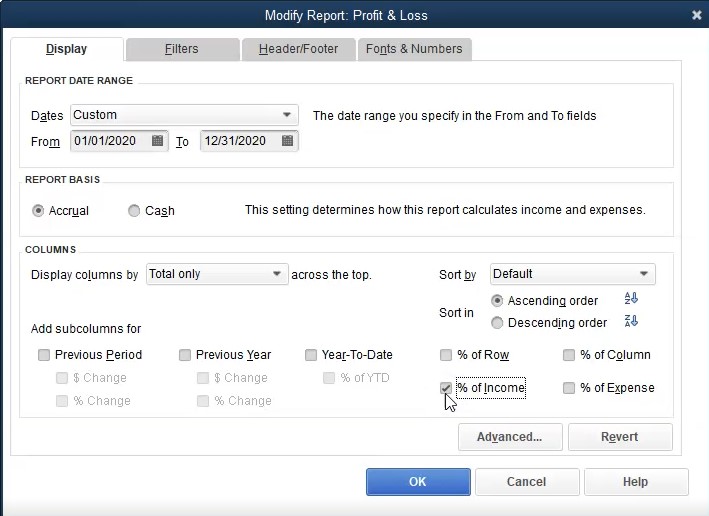
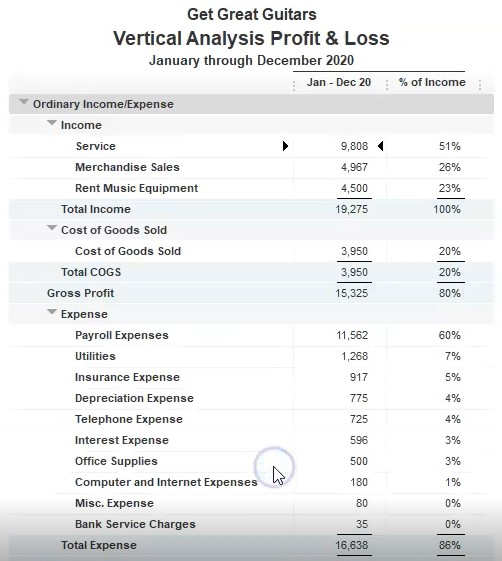
To do so we’re going to go to the customized items up top, we’re going to be down here in the percentage of income, that’s the one we want, we want to select the percentage of income, then I’m going to select Okay. And then we have our percentage of income items. What does this look like it’s a little bit different than some of the other percentages we have seen so far. So let’s consider it all the top items here are part of income.
2:16
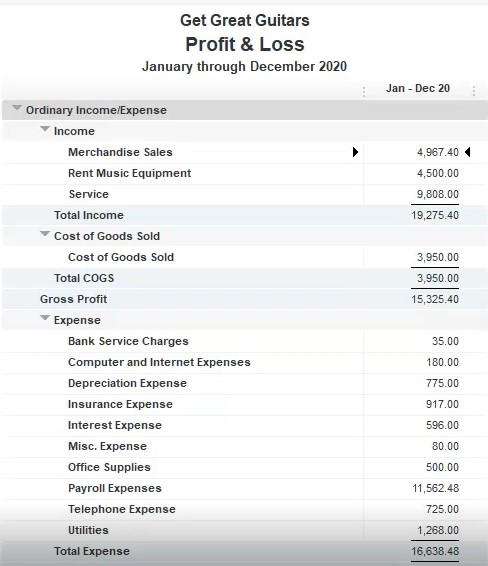
So you’ll note obviously, if we take the percentages, it’ll add up to the total. In other words, if I took the merchandise sales of the 497 9.4 divided by the total income of 19274 5.4, move the decimal over two places, we have 25.8%, rounded 25.8%. So these these are all the income types, if you add up the income accounts, they add up to 100%. The cost of goods sold then is an expense type of account. If we compare it then to income, if we take this cost of goods sold and say 3950 divided by 1927 5.4, we’re going to get the if you move the decimal over two places 20.5%. So cost of goods sold is 20.5% of the total income. And usually that’s going to be a really important relationship.
3:11
Not it’s a little bit skewed here, because note that we have more than just merchandise sales, we have other sales here. And the cost of goods sold is not going to be have the same relationship to service items as as the inventory items, then we can do this with any of the expense accounts down below. If we were to take for example, obviously payroll is quite large expense account 1156 2.48 over the revenue of the 19 to seven 5.4.
3:39
We could say wow, that’s going to be if I move the decimal point around 60% of the income. And you could see that relationship on a percentage basis. And again, you can think of that, well, what if I looked at another company that also sells guitars and has service and they might be larger than us, we can’t compare our revenue item to them. But as their revenue items 60% or is their payroll 60% of their revenue is their cost of goods sold only 20% of their total revenue, we can do comparisons like that and help us to benchmark and so it’s a really useful tool to have. Now we’re going to make some other changes here.
4:15
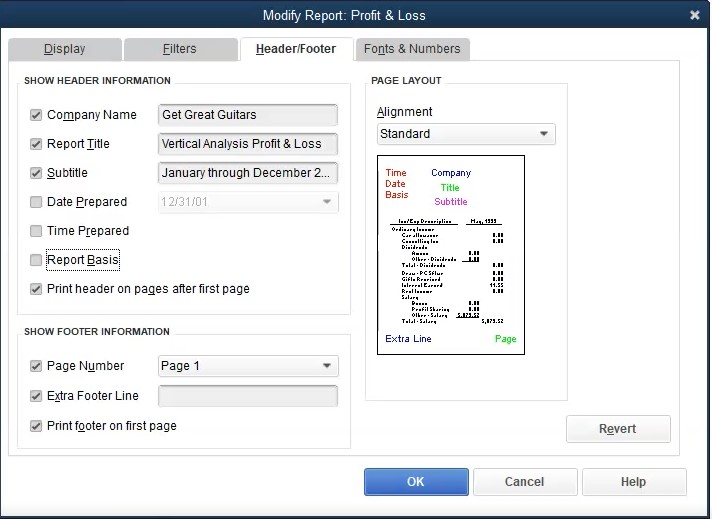
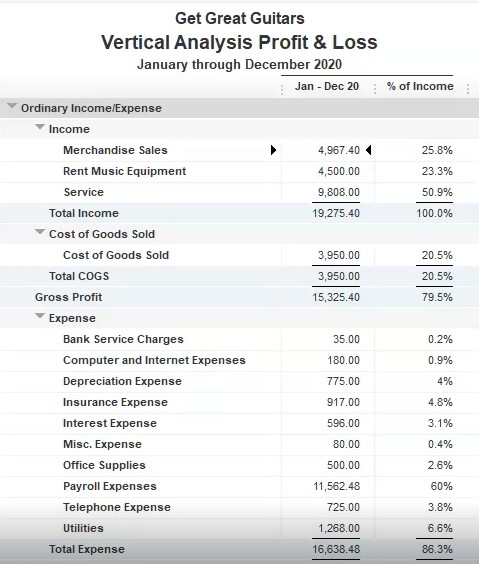
Let’s change some formatting, we’re going to get rid of these items, we’re going to rename it to a vertical analysis, profit and loss reports. So we’re going to go up top, customized report headers and footers. We have the profit and loss we’re now going to call this a vertical save for to go and now assists hopefully I spelled that right vertical analysis Profit and Loss report, we’re going to keep the date that looks good the the subtitle, we’re then going to remove the date prepared time prepared and report basis that will remove in these three items. Let’s see what that looks like so far. We say okay, so we we have removed these we’ve renamed the
4:56
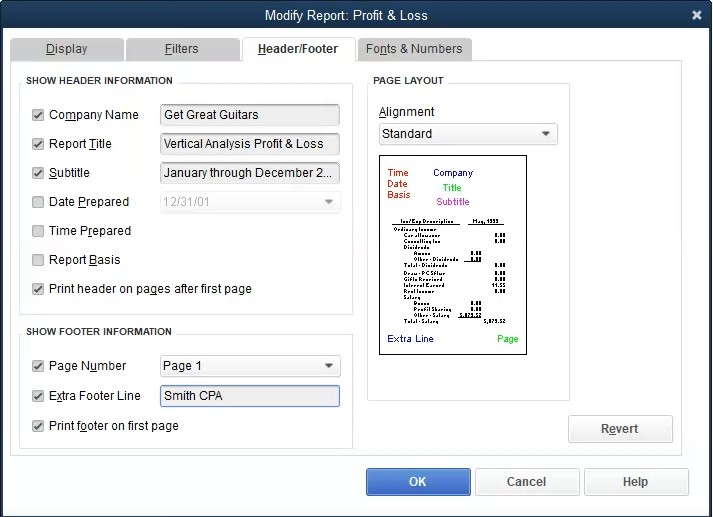
title. Now let’s go back and put our footer in place the extra footer, I’m going to go to Customize reports, header and footer tab. And the extra footer, we’re going to say this is the Smith, CPA, and we’re going to say okay, let’s check that out by going to the print item here report, we’re going to preview take a look at it. Then if we go down here, we see that our title there. So that looks good, we have the footer in place going to close this back out, close this back out. Let’s do some formatting.
5:28
Let’s remove the pennies on this report, get rid of the change. And then let’s make the negative numbers with the brackets once again. So we’re going to go up top to the reports, we’re going to go to the fonts and numbers, I’m going to make the negatives with the parentheses, we’re going to make them read, I’m going to use a remove the pennies by removing the pennies here and say okay, see what that looks like, looks a little bit cleaner so that we can see that now. And now we want to I’m going to put the highest amount of top within the category, we could do that here.
![]()

6:01
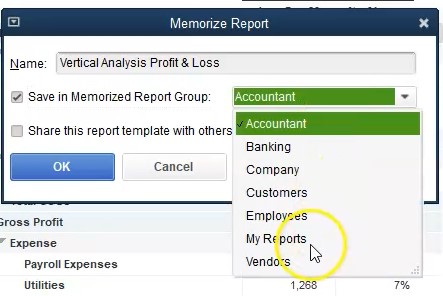
We did that last time. Let’s now do that over here in the customized reports, we can do that in the default, we want to go to the totals, and then I want to put it in descending order totals and then descending order, then I’m going to say okay, and there we have it. So now we’ve got the higher numbers up top, and then it goes down to the lower numbers. So that’s what we have. So far. Looks pretty good. Looks pretty nice. Let’s go ahead and memorize this report. So I’m going to go to the memorized report up top, we’re going to change then the name actually looks good. The vertical analysis profit and loss.
6:32
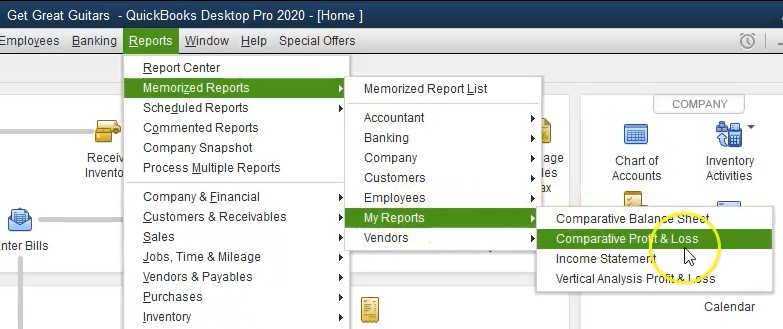
That’s what we want. Going to put it into the save in memorize reports group, that group that we had set up in a previous presentation, selecting the drop down, we called it my reports, because they’re the reports that we made. So they’re like my reports. And we’re going to say okay, and it takes a little picture. And then we’re going to close this out. And we’re going to reopen the reports from the memorized report of my reports. So we’re going to close this back out, we’re going to go back to the reports drop down up top, we’re going to go then into the memorized reports, and then down to the My reports. And now we want the vertical analysis Profit and Loss report. There it is looks great.
7:13
Now we’re going to go ahead and save this in a couple different ways. We’ll save it as a PDF file will then export it to our existing Excel worksheet. And then we will save all of the reports we have done so far in one PDF file using that Excel worksheet. And let’s do that now we’re going to go to the reports up top, I’m going to use the Q to predict PDF printer this time by going to the Save as a Actually, let’s do that again by going to report print reports.
7:39
Then we’re printing to the PDF printer, then I’m going to say print. And we’ll get the dialog box of where we want to put it. I were in section one through four, I’m going to go into the financial statement reports. I’m going to then under or put my box here the little box right under the title so I can see the title. And then I’ve been the title, which is going to be the vertical analysis P and L 2020. And I’ll save that.

8:11
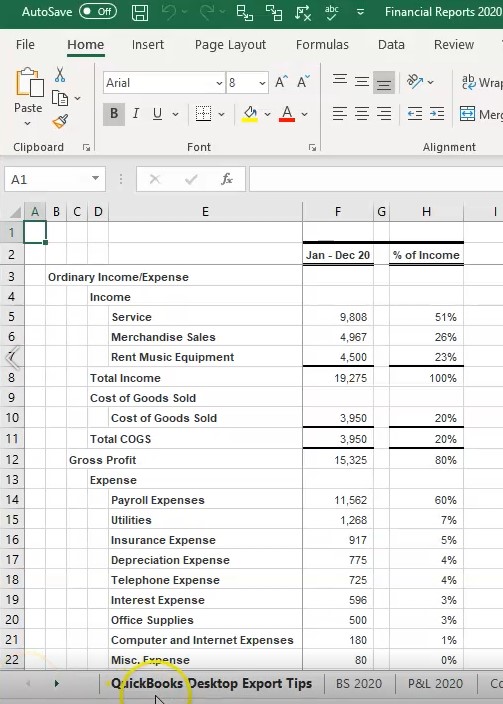
Now we’re going to export it to excel the existing workbook that we have been working on throughout this problem, we’re going to create a new worksheet within it, then we’re going to put it to an existing workbook. If you don’t have the workbook, you can then create a new one here, but we’re going to put it to the existing workbook, we’re going to then browse to find where that workbook might be. Then we see here, we’re right where we want to be section one through four, there’s our workbook. Double clicking on that, then exporting to it.
9:53
So we’re going to go up top to the File tab, we’re going to go to the printing options, I’m going to printed to the cute PDF printer, I want to print the entire workbook of which there are now eight pages. If we scroll through those pages, just to review them, make sure everything looks okay, everything looks proper. And as I expected, it does look perfect. So we’re going to go ahead and print it now.
10:17
So we’ll print it to the PDF printer by selecting the print item will then get the printing dialog box to say hey, where do you want to put this thing, and we’re going to put it into our folder that we’ve been working on section one through four, that’s where we want it, we’re going to be putting it into the financial reports 2020 that’s the one and save. So we’ll save that I’m going to write over that file.
10:39
When we do save it. Let’s open it up, see what it looks like. So if we take this file and open it up, we’re going to say that we now are in section one through four. And we have the couple formats. I’m going to delete this one because because we’ve changed it the zip file. Now it’s this copy of this folder, deleting that we could have good we give this information to somebody at this point, we could give them an attachment of all these files, which there’s a lot now I’m not even going to count them, it’s too much for me to count I got I got we’re going to go back over here, we could zip that file and attach just one zip file by right clicking this file and go into a compressed or zip file attaching just simply that one file little bit easier, a little bit nicer.
11:23
Or we can attach the Excel file if someone is okay with an Excel file. Or we could have used that Excel file to make one PDF file and then attach the one PDF file. If we were to open that up. This is what that would look like. Where we now have the balance sheet. We now have the profit and loss report. We then have the comparative balance sheet within have the end of the comparative balance sheet and then the summary balance sheet and then the income statement and then the comparative profit and loss and then the vertical analysis report. We can give them all on that in one format using basically the Excel and the PDF printer.