
This presentation we will generate analyze Export to Excel and print a sales by customer report within QuickBooks Pro 2020, QuickBooks desktop 2020. Here we are in our get great guitars file, we currently have the open windows open, you can open the open windows by selecting the view drop down and the open windows lyst.
0:21
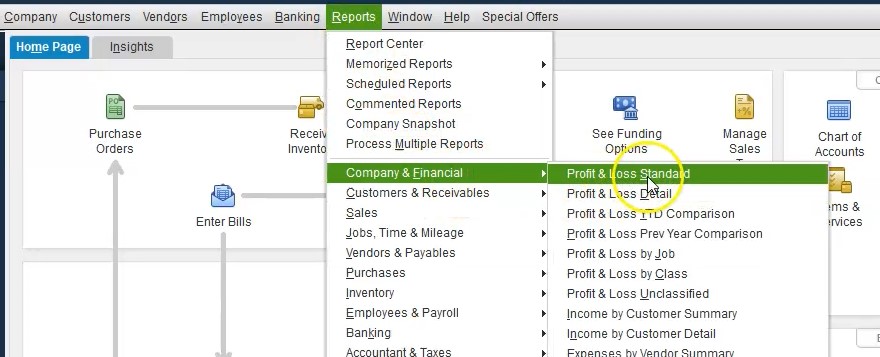
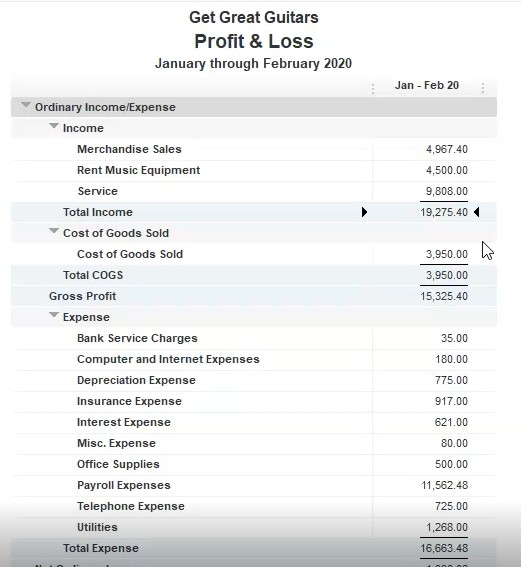
We’re not going to be generating more reports. And remember whenever we think about any other report other than the major financial reports, which are the balance sheet and income statement, and they will typically be supporting some portion some area within the balance sheet or income statement. In this case, the sales by customer will be supporting the income statement. So let’s first open up our profit and loss statement and always be branching out from those those core financial statements into these other reports or as we consider them, let’s go to the reports drop down Up top I’m going to go to the company and financial will first take a look at that profit and loss standard report, changing the dates up top from a 101 1012020 220 920.
1:05
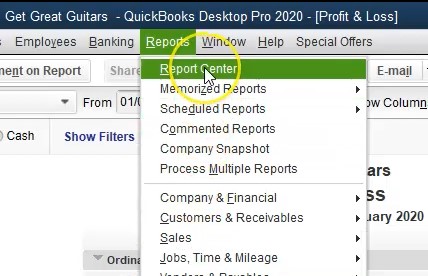
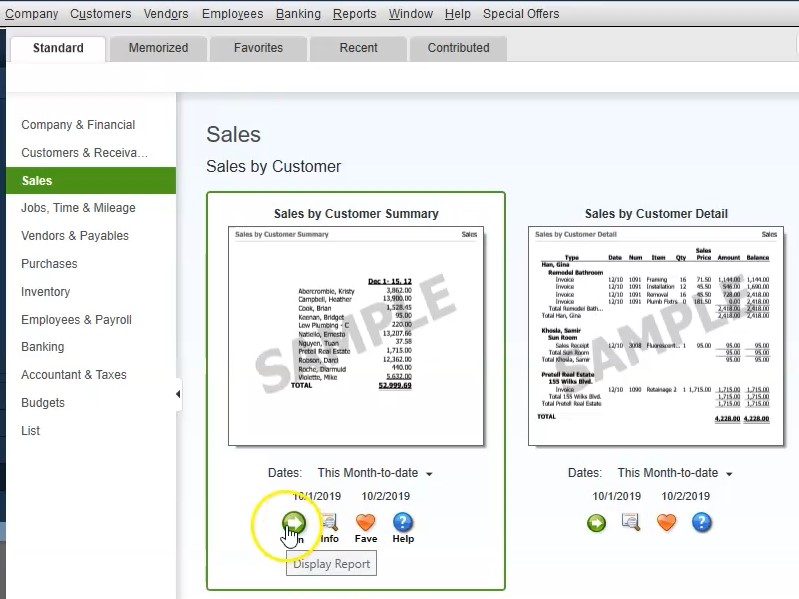
There’s our profit and loss report up top, of course, is our sales items. That’s what we’re going to be concentrating in on when we consider the sales by customer Summary Report. A couple of ways we can get into the sales by customer summary report, we can go to the drop downs up top, we can go to the sales item and find it here. If you’re not as familiar with some of these reports, then However, you may want to be using the report center. So it might be easier to go to the report center as we will do here.
1:32
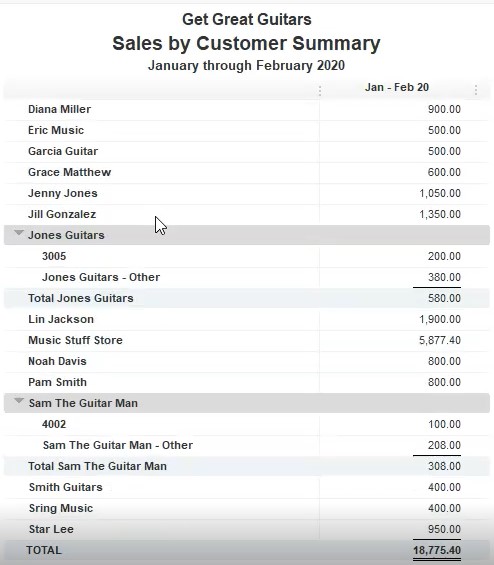
Open up I’m going to maximize the screen. In other words, we are in the standard tab, we want to be down in the sales area. So standard tab sales tab, we have the sales by customer summary, that’s going to be our first report, we can change the dates here, if we so choose, I would simply just run the report generally. So I’m going to run the report, do any day changes here as we will now with a starting date of Oh 101 2020 220 920, January through February 2020.
2:06
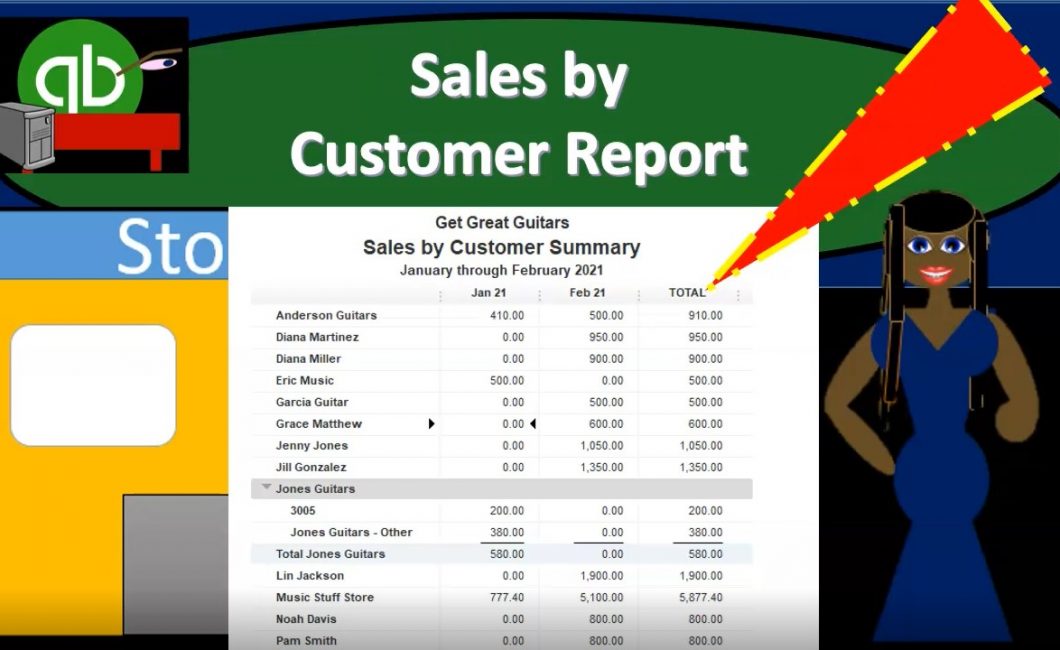
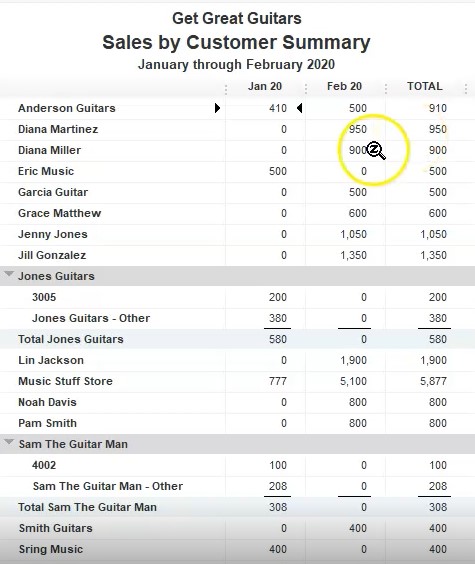
If we scroll down to the bottom, obviously we have our customers this should support then what we have on our profit and loss, we’re going to have a bit of a difference that we have seen in the past. Let’s analyze and think about why that would be so that when we present this report, we know exactly what that difference is. When 877 5.4 minus if we go then to the profit and loss report, we have the 19 to 75 minus 1927 5.4 $500 difference. What is that closing this back out. If I double click or zoom in on the merchandise sales, zooming into it, we had an adjusting entry for that $500.
2:52
That’s the difference. It’s an adjusting entry. That’s as much details will give to it right now. We’ll get into why we haven’t adjusted entry later in the course. closing this back out, we can then go by to our sales by customer summary. So here’s going to be our sales by customer Summary Report. Obviously this report is breaking out the sales item by who we sold to.
3:15
And this is really important because a lot of times when we when we start to set up accounts in a profit and loss statement, for example, different types of accounts, we may be tempted for example, if I go over to the profit and loss to set up different type of accounts here, an actual account to represent groupings of customers possibly or different, a lot of different items that we are selling in essence, what we want to do, however, is limit the amount of information we aren’t we want on the profit and loss, limit the amount of sales or income type of accounts, and then use the detailed reports to give us that more detail.
3:54
So don’t get don’t get caught up and sent train trying to put all the detail into the profit and loss report by adding up bunch of accounts here. Think about how you can group your accounts here to give you that summarize data in a way that you want. And then use reports such as the sales by customer summary, which can then take those totals take the total sales, break it out in more detail, such as the customers, you could also do the same thing for sales by items.
4:21
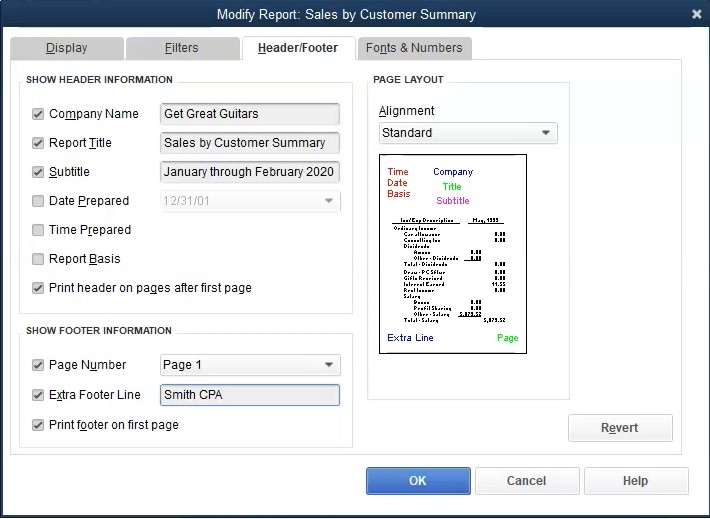
So I’m going to go ahead and then format this, we’re going to go up top, we’re going to do some of our standard type of formatting, we’re going to go to the header and footer, we’re going to remove the date prepared the time prepared report basis, we’re going to put the name of our firm and the bottom here, which is going to be Smith CPA for us, which is obviously generic name, then we’re going to go to the fonts and numbers.
4:44
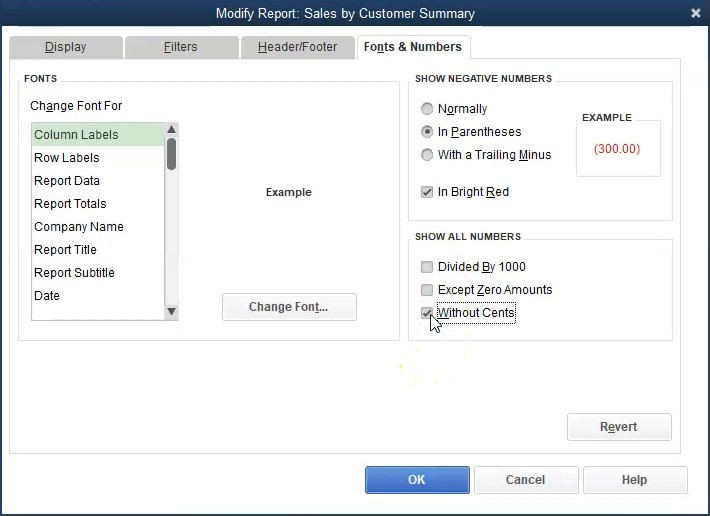
And we’re going to be taking any negative numbers I’m going to put parentheses around we’re going to make them read to match what we have been doing in prior reports, we’re going to remove the pennies to have no sense within the reports no pennies did the reports don’t will make sense but no pennies and nickels. So we’re going to say okay, and there we have it a little bit cleaner, have a report, we’re also going to break it out. So we can see the sales for January and February by customer. To do that. Let’s go up top here and go to the total. And let’s say months. And so this is an income type of report. So now it’s going to give us January in February, and then sum them up for the total.
5:21
So we got January, February, February and the total. So that looks pretty good. Let’s go ahead and print this out, we’re going to print it, then we’re going to export it to excel, then we’re going to create our PDF file with all the reports we have so far up to this point in time from the Excel worksheet. To do that, what’s going to go up top, we’re going to go to print, we’re going to print it here, we’re going to print it using our cute PDF printer, we’re then going to say print, and then we’re going to get the dialog box where we can then save it, I’m going to put it into the financial reports, I’m going to put our little dialog box right underneath the area where I can see the title and then type the title by the being able to see it.
6:01
And I get rid of that extra t and this is going to be the sales by customer summary, let’s say 2020. And then I’m going to save that now will export it to Excel will export it to an existing Excel workbook that we have set up in prior presentations, we’re going to create a new worksheet within it. And then we’re going to put that new worksheet in an existing workbook, we will then browse define where that workbook is, there it is in section one through four, double clicking on that Excel file and then exporting to it.
6:35
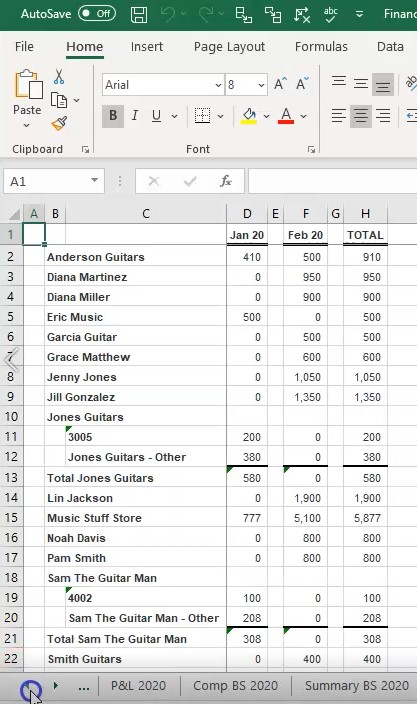
Here we are in our Excel worksheet, we’re gonna do our standard kind of formatting here, we’ve created some new tab, I’m going to go all the way to the left, I’m going to delete this new tab by clicking on it right clicking on it, then deleting it, then I’m going to delete here, and then we’re going to go back to the right, we’ll go back to the right we’ll see that new sheet that we just made. Clicking on that sheet, I’m going to drag this all the way to the right, so it’s an order as on the order that we put this thing together.
7:02
There’s our sheet, I’m then going to go to the Page Layout tab, I’m going to say okay, we see these funny splits, I would like to get rid of those, we’re going to go to the View tab up top to do so we’re going to go to the windows group and then uncheck the splits area, removing those splits, renaming the tab as we have the name open here by double clicking on the sheet one. And then I’m going to put sales by customer. And then 2020, something like that, click off of it. And then I’m going to go back to the normal view.
7:33
There we have, it looks pretty good. Let’s go ahead and print this entire thing out on one PDF file, we’re going to go to the File tab we’re going to go then to the printing options, we’re going to print not just this worksheet, but the entire workbook. By going to the print entire workbook, we now have 13 pages. As we scroll through here, we can just review what it will be looking like we’ve recalled that the graphs aren’t aren’t formatted perfectly, but it’s just we’re just just an example of how you can format the graph.
8:02
So we’re going to we’re going to go by that that’s okay. And then there it is, that all looks good, we’re going to go ahead and print this out to the cute PDF printer. So it will then save it as a PDF file, we’re going to select the print button, it will then give us a printing location where we’re going to put this thing. Hopefully, there it is, and we’re going to put it in the section one through four, we’re going to overwrite this file to put the new one there will then save it. And Okay, so we’re now in our get great guitars file and we’re going to open up the section one through four. So there is section one through four.
8:37
We could say this in a few different ways. I’m going to close this one out. So I’ll close this out. And then I’m going to open up the financial reports. So here’s the financial reports, we can attach each one of these files if we so choose. Or we can go back to the section and we can give them the Excel file. Or we can zip them file right clicking on it and create a zip file by sending it to a compressed or zip file.
9:07
Or we can give just simply this one PDF file that we created from the Excel worksheet which has everything in it which now includes the balance sheet the profit and loss report that compare the balance sheet and the end of the comparative balance sheet this summary balance sheet, the income statement, the comparative profit and loss. The vertical analysis report the sales by customer summary the graphs which aren’t formatted as well as they could be but weather is good enough for now for an example, and then we have another graph for the expenses. The sales by customers summary report