
This presentation, we will create a sales by item report within QuickBooks Pro 2020, QuickBooks desktop 2020. Here we are in our get great guitar file, we currently have the open windows open, you can open the open windows by selecting the view drop down and the open windows lyst. We’re now going to be creating a sales by item summary.
0:20
We know that any other report other than our major reports, the income statement and the balance sheet are going to be supporting in some way, the income statement and balance sheet the sales report anything that says sales related to it is talking about income and income type of account or revenue type of account.
0:37
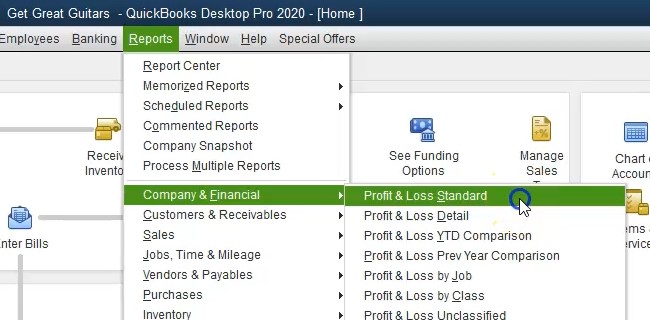
Therefore, it will be supported in some way the profit and loss report, we’re going to start off there, we always want to think about, you know what’s going to be the source document or what kind of what is the financial statement that this report will be supporting. So I’m going to go to the drop down for the reports, we’re going to go to the company and financial We will then select the profit and loss standard, we’re going to change the dates up top from a one on one to 020 229 to zero that’s January through February 2020.
1:05
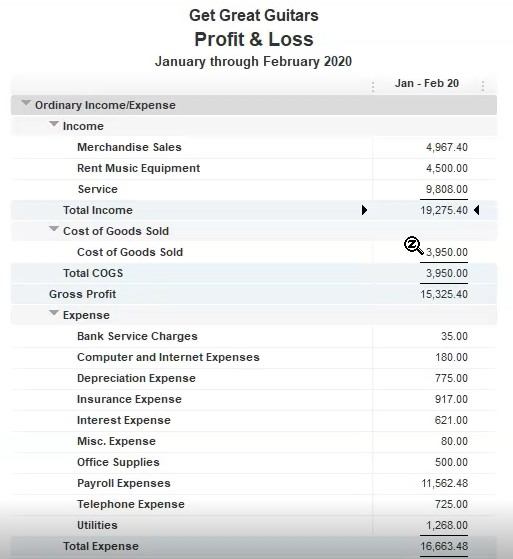
We’re talking about sales, therefore, we’re thinking about the income items. And we’re considering this total sales or income of 19,000 to 7540. Now let’s consider the sales by item summary, we can get there in a couple of different ways. One, we can go to the reports drop down once again, we can go to the sales and then find the sales by item summary. Or if we’re not as familiar with these types of reports, it might be easier for us to then go to the reports center as we will do now, reports drop down then reports center, I’m going to maximize this screen.

1:40
We’re currently in the standard tab, we’re going to then go down to the sales within sales, we want to look at the sales by item. So if I we have the sales by customer sales by customer detail, then the sales by sales by ship address, sales graph, and then we have these sales by items. So we want these sales by items summary as opposed to the detail, we could change the dates here, I would just run the report and then change the dates.
2:09
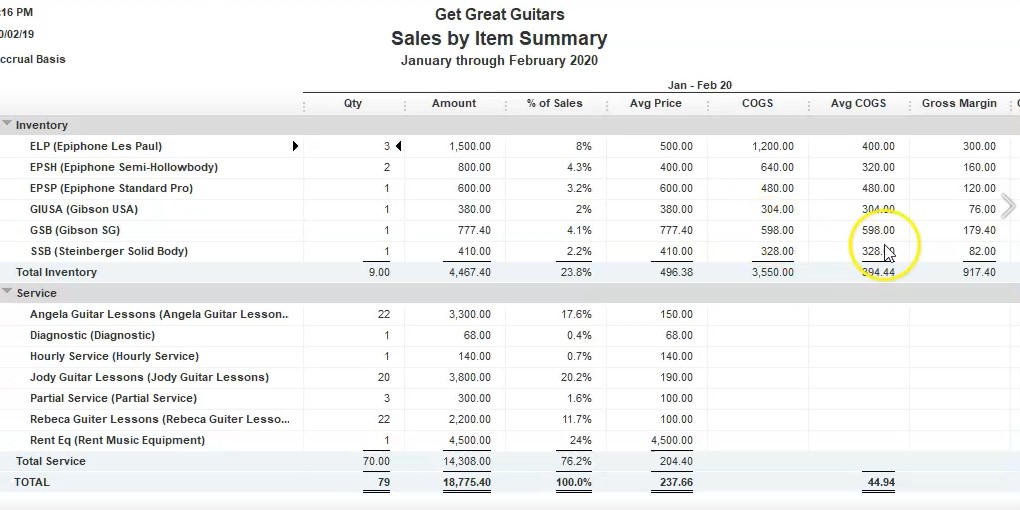
Once it is open, there is our reports, we will now change the date from a one on one to 020 229 to zero that’s January through February 2020. So this reports a little bit more detailed. So it’s a little bit more confusing because in it Well, the main reason is because we have the inventory items as well with the cost of goods sold and average cost, and so on and so forth. However, the total bottom line number is that 18 1818 770 5.4 that’s the amount that we can tie out to the profit and loss or should be able to however, it will be off 18 775 point four minus. And we’ll think about why it will be off.
2:51
If we go to the profit and loss report, we’re currently at the 19. So minus the one that nine to seven 5.4 is off by that $500. You’ll recall that that $500. If we double click on the merchandise sales, double clicking on merchandising sales is and adjusting journal entry. So just noting that now we’ll talk about why the adjusting journal entry is there when we get to that in a later point in the course, closing this back out.
3:19
Going back to the sales by item summary, if we analyze this report, it’s breaking it out between inventory items and service items. So these are the two types of things that we can sell. You’ll recall that we talked about lists up top in the drop down before and we talked about the item list.
3:37
Within the item list. We have inventory items and service items, these are the items that are we are going to sell the items that we will set up these items will then be used to generate the sales receipts and invoices that will be used to generate sales, which of course this report is now being generated from as well. It’s supporting the sales number on the income stage it so it’s breaking them out, we sell in our case guitars. So these are the guitars we sold. And then we had the service items.
4:07
These are going to be the service items, we had the Angela guitar lessons, diagnostics, hourly service, and so on and so forth. When we think about the inventory, the more complicated of the two sections typically, because we have to deal with the inventory, obviously. So the we have the guitars here, this is the quantity of sales, this is the amount then of the 1500 total. So in other words, we sold three of these items that total out to be total sales of 1500 for the three of them, then we have the percentage of sales, the percentage of sales, for example, would take this 1500 divided by the total sales of 1877 5.4.
4:43
That and if I move that over be about 8%, moving the decimal place over two places and rounding, then we have the average price. In other words, the price of 500 times three is the 1500, then we have the cost of goods sold total for the three items was 1200, then we have the average cost. In other words, the 400 times the three units gives us the average cost of 1200. Then we have the gross profit, which is going to be the 300, which is the sales minus the cost of goods sold. And then we have the gross profit margin, the gross profit margin calculated as if we pull up the calculator here, the gross profit, which is going to be the 300.