
This presentation we will generate, analyze, print and export to an Excel a restricted net asset detailed report and get ready because here we go with aplos. Here we are in our not for profit organization dashboard, let’s head on over to Excel to see what our objective will be. We’re currently in the 10th, tab, tab number 10. And last time and a few prior presentations, we’ve been creating the statement of activities, including three columns, two columns, for width restrictions, without restrictions, we then broke out the width restriction column out into the expenses by both function and by their nature.
00:40
So we had another sub report basically, breaking that out, now we’re going to be breaking out this side of things, which is going to be the restricted items. And you can imagine the next question that would happen. If you were to provide this report to somebody they would say, Well, what other restricted items? Can you give me detail on that? That asked that question could be asked with the statement of activities. And it could also be asked, with regards to the statement of financial position, which you’ll note also has the net assets being broken out to those with restrictions and without restrictions, the ones that have restrictions, you could then get the question, well, what are those restrictions?
01:17
And how can you know, how can I still want to spend the money somehow? And how can I How can I spend the money within the restrictions component? Okay, so then, if we go back to our report, then let’s open up our reports, we’re going to go back to aplos, we’re going to be opening up the reports on the right hand side, then we’re going to be looking at our income statement, income statement by fund here, but we’re going to do the one that we created down here, we’ve been making these reports these custom reports or saved reports, where we have the statement of activities, and the statement of activities worksheet, let’s consider the worksheet at this time, since we’re focusing in on another report.
01:56
And this is the one we use to kind of, you know, work on with the worksheet gives more detail in essence, and then let’s change the date up top, I’m going to make the date for January drop down, we’re going to say let’s make this a custom date range and make it for January, bringing this on back to January 1, and then the to date being the end of January, which of course is the 31st of the month. So we’ll then say apply that. Alright, so now we have a similar kind of layout that we saw, we’ve got the restricted items unrestricted, and then the total. So we have these two columns. And then these two columns, we break further out, in other words, by tag or with the use of tags. So we’re now going to break out another report on this for the restricted items. Now note that when we when we look here, in the restricted column, we only have items kind of above the income line, even though we have this negative income line down here.
02:55
And that’s because from an income perspective, we’re going to say if money comes in and a restriction has been placed on it, we’re going to be putting it in the restricted items. And then when something has released from restrictions, we’re going to show that by decreasing the restricted items using still an income account. And then increasing the unrestricted therefore all the expenses in essence here are being shown in the unrestricted, and we’re really concerned with the kind of income line items for the restricted items. Now these are the restricted items that in this current time period, have been in some type of restriction and you’re going to hear the question most likely, if you’re presenting this to the board or something like what type of restrictions Do we have, we’re going to then give another report for those types of restrictions. Now, again, this is for a term current time period.
03:40
Note that over the life of the organization, will have restricted and unrestricted on the balance sheet, where we have a similar question, you know, what’s going to be the activity or the things that are involved in the restricted items. Okay, so for that, we’ll run another report. So we’re going to, we’re going to right click on this tab up top so that we can not delete this report, and we’ll duplicate this tab, go back then to the tab to the left, we’re then going to go to the reports all the way on the right. And we’re going to be going down and opening up another income statement. But this being an income statement by tag, so we want to be in the tag reports. We want to be in the restricted tags this time. Let’s open it up an income statement by restricted tags, then we’ll change the dates. Let’s make a custom date.
04:30
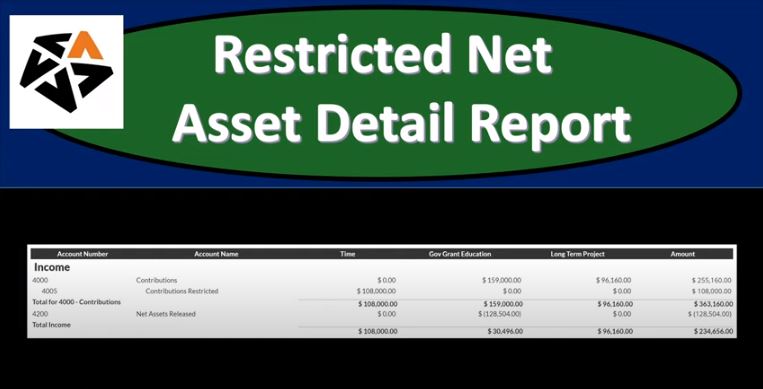
Let’s make it for the month of January because like that’s the month we’re working on. So it’s going to be January 1 through the 31st of January have said month of January. So we’ll save that. And then I like to make sure that all the filters are there. So we’re in the unrestricted now. So we’re in I’m sorry, we’re in restricted report. And so they’re all checked off. That’s good. So I’m going to say all right, that looks good. And then we have our information up top so we have to click Kind of categories of restrictions. I know they’re very, they’re very broad categories, but a time restriction government grant education, long term projects that given us our total over here, that and then and then we have the amounts that were released from restriction that 128 504, because part of the restricted requirements have been met.
05:22
In other words, we spent money on education in this point. And that means that this was reduced. So education, this restriction in total, have the 159 minus that 128 504. And that’s the total down here, this this total that to 34 656. If we go then to this statement of activities, we should be able to see it there as well, to 34 656. So that looks good. Let’s go back to the prior tab. And so that’s going to be our information for the restricted items. Now also, just note that because we only have one month of operation, these numbers will also tie into the balance sheet account for the equity or net assets section. However, if this wasn’t only one month of operation, then what you would simply do is run this if we have two years of operations, or however long the operations are, you could run this report then for the life of the of the project or the organization. And then you can see again, the breakout that should tie into the net assets on the balance sheet. So that’s one way you can get to that information.
06:29
For the purposes of this time period, it’s going to be the same because once again, first month of operation. Now there’s not a whole lot of formatting we might need to do here except on this one, we could group this together here because we have the contributions, restricted and just the contributions up top. So this is a subcategory. In other words, the contribution is restricted here. So if we went up top, and he said who maybe I can, I can go up top and say, I don’t need the sub accounts for the external use. So I’m going to say remove the sub account. And that’ll give us a little bit cleaner of a report. So now we’ve got that grouped together. So I probably wanted broken out possibly for the worksheet grouped together for the external report. And then I’m going to go ahead and save this. And one of the things I want to save when I do so is going to be the name of the report.
07:17
So I’m going to say all right, let’s go ahead and save this report. And then I’m going to call it something like restricted net assets detail report the to the tail report. So I’ll do my best to spell it right, probably maybe not my best, but I’ll put some effort in to spell it correctly for you there. So then we have that. Okay, and then we can go ahead and do the same process, we can print this, we want to put it onto our Excel worksheet and be able to give this report along with the other reports that we have created and generated thus far, we can give it like this is probably won’t bother anybody that the fact that we have that kind of the expenses down here and don’t need it. But we could also clean it up if we send it to excel. So we could clean it up a little, which means just removing basically the expense, we don’t really need the net income column. But again, this report as is pretty nice. So the other things we can clean up if we want to, we don’t have to it looks good like this.
08:15
But we can take out the account numbers, if we want, we can remove the decimals and do that kind of formatting, if we so choose not necessary, but you could do that. Also, we just want to put it into Excel so that we can then print it all using that cute PDF printer with one easy format. So then I’m going to go to the print. So let’s see if we can download it as a PDF. So it does allow us so it’s not too long, apparently to download as a PDF. So let’s do that. So that’s one way we can, we can format this and then I’m going to put it into our folder over here. And I’m going to just pull it over. So there we have that, and I should probably rename it, I should probably rename that one as well. So let’s right click on it here, and then we’ll rename and I’m going to make it a restricted net asset Detail Report.
09:19
You got to talk like that when you rename stuff. So yeah, helps me spell and then I’m going to go back on over here, then I’m going to download it again. And then we’re going to say it’s an Excel sheet. So I’m going to open up the Excel sheet now. I’m just going to open it up, I’m not going to drag it into the folder because I just want to take those contents that are going to be in there and put it onto our other Excel worksheet that we have all of our financial statements on.
09:43
So here it is, I’m going to enable it so we can edit it. I’m not going to make any changes here because I really wanted on the other Excel worksheets. I’m going to go to my other Excel worksheet, and that one, don’t know I have this open already. I’m going to open this out. It’s going to be in the financial statement. This is where We have the prior two reports that we’ve already put together. Let’s open that one back up. There it is. And now I’m going to go and just pick up the data or I can make a new tab for let’s make a little plus I’ll plus new tab, new tab down here. By hitting the little plus, it won’t let me do it hold on. So there it goes, it was being stubborn. Alright, now I’m going to go back on over and then I need to select the entire worksheet.
10:23
So I’m going to select the triangle up top, that’ll pick the entire worksheet, right click on the selected area, I’m going to copy it, then I’m going to go back to our prior tab, you have to be in a one remember, or you could select the entire worksheet with the triangle, if you’re in a one, that’ll be sufficient. So then we’re going to paste that. And then I’m going to just rename the tab double clicking on it to do so I’m just going to call it restricted items, items. I’ll call it that. All right, and then let’s do a little bit of formatting. Now. Now the format is pretty good to go, all you really need to do is basically make these columns large enough. So that so that you can see the numbers here. Now, I would also wrap these texts, pretty, pretty basic format AT HOME tab alignment, and then wrap the text and center the text, that’s probably the minimal you need to do. And you’re pretty good to go.
11:18
So now I’m going to go through my overkill here on on it. So this is what I think, after doing this a few times, I think the best way to do this, I can also just pick this name, I like I think this formats, the easiest way to do if, after working on this a few times and go over to the page layout and just put that right in the header, just go boom, put that in the header. So that looks good. Did I pick up the whole name, I missed a line, there’s a line missing? Oh, hold on a second. Let me do that. Again. I’ll throw those another time. One more time here. We’ll bring this over. And then there. All right, that’s better. Okay, so then I’m going to go back to the prior to the prior screen, so it doesn’t show up up top of the header will be there. I don’t need this header, don’t like it, don’t want it going to remove it. Don’t need this header.
12:14
Don’t like it don’t want it going to remove it. Anything that’s going to be a merged cell, I’m going to unmerge because they mess me up. So I’m going to go to the Home tab, I’m going to go to the alignment unmerge that I’m going to go do that here. Home Tab alignment, get rid of the merge Home Tab alignment, get rid of the merge. So again, that’s probably all you need to do. But I don’t really need these these income accounts. So I’m going to just get rid of that whole column. So what I want to do is move the income to the prior column. So this column, so I can delete that, that column. So again, merge cells, so I’m going to go home tab alignment, merges go away merges, and then I’m going to cut this one, I’m going to put that over here, paste it. And then total expenses, merged Home Tab alignment, get rid of the merges, stop with the merges.
13:07
And then I’m going to right click and cut that and put that over on the next cell, then I can delete this whole column, I don’t need I don’t need this column, there’s something else merged here. That’s merged. Home tab, alignment unmerge. And then I’m going to cut it and put it over here. This is merged Home tab, alignment unmerge. And then I’m going to cut it and put it over here. And this net income we don’t we don’t need really, I don’t need the expenses or the net. And all I all I really need is this bottom line. So I’m just gonna actually delete rows 11 through 13, just right click and just remove those all together. And then I’m going to remove column A, I don’t need column A, it’s useless to my end readers at least.
13:57
And then we’ll do some formatting to the numbers because we did that before. So I’m just going to format these numbers, highlighting them, right clicking on them, formatting the sales of them, and then go into currency. I like to do currency, no decimals are no decimals, read numbers for negative numbers to really stand out and say, Hey, that thing is negative. All right, so there we have it. So So now we can, so it’s a little bit cleaner. So again, you don’t need to do all that. But I think it’s just the simpler, the easier the report is to read, the more likely people may read it. So then I want to print this report with all of these on it. And of course, you can send this to a printer and it’ll be correlated as well for you. So to do that, we’re going to go to the File tab, we’re going to go to the print button.
14:44
And then I’m going to select the drop down here we want not the active worksheet, but the entire work book. And so there’s page one that we have page two, and you can see the difference with the headers up top so the headers appearing pretty nicely and here’s the one We just did. And again, the headers appear in pretty nicely, it looks pretty clear and looks pretty clean. Looks pretty nice. So now we’re going to print it to the cutepdf printer. So it prints all of those on one PDF file, which of course is really impressive, really exciting. So then we’re going to say it’s going to ask us where do we want to put it at some point, there it goes. Now I’m just going to rewrite or overwrite the financial statement here, because I’ve just changed it. So I’m just gonna save over it. And there we have it.
15:30
All right, so now let’s close this out. And let’s save the changes. I’m going to minimize this. I’m going to minimize that. And then now we have our reports that we can attach one by one if we so choose, we can print them from the Excel file or we can give this one PDF file as the attachment if we open up that PDF file, then using Excel and the cutepdf printer, we got all the reports on one, one sheet here. So that’s gonna be it for now. Let’s get out of here.