
In this presentation, we will calculate the bond price explaining how this can be done using present value formulas within Excel. Remember that the bonds is going to be a great tool for both accounting and finance to describe the present value calculation. So that’s why it’s going to be used. Oftentimes It has two cash flows related to it, one’s going to be the face amount of the bond that’s going to be due at the end of the term of the bond. In our case, it’s going to be two years semiannual or four time periods. And the other is the flow of interest. So bonds are a great example because they have the two types of present value problems that we need in one area. So even if you’re not in an area where you’re dealing with bonds all the time, they’re still going to be used and useful to understand present value types of calculations. So here we’ve got the bond is going to have one cash flow of 100,000 at the end of four periods or two years, and we need to figure out what the present value is in order to price it back here at your at time period zero. And then we have these four payments in terms of the annuity 4000. And we need to take those and present value them, we could take each period and present value each payment and present value it. But the easier thing to do is to present value, an annuity when it’s applicable and present value, the one amount when it’s applicable. And therefore think of that about these as two basically separate cash flows that we’re going to have to present value separately. So we can do this multiple different ways. And it just depends on what you’re what tools you have. And where you are, in order to know how to do it. What you want to know is just that there’s different tools to do it. Anytime someone uses a different tool. What are they doing the same thing? And and when can you apply these tools and what’s actually happening here. So that’s what’s actually happening. We’re present valuing this information.
01:54
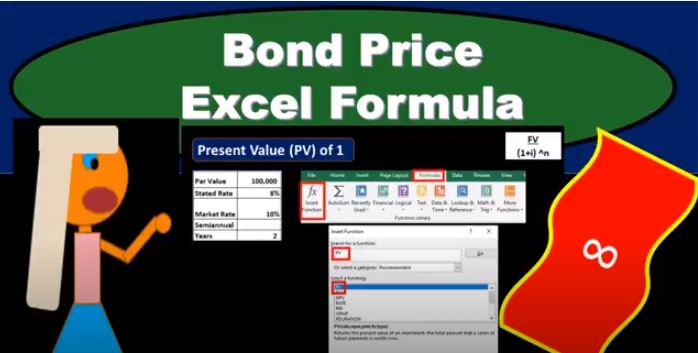
We could do that with a formula. We could simplify this process by by using a calculator. or using Excel as we’ll do here, or tables, it’s all the same stuff that we’re doing, just be aware of those different kinds of ways you may be asked to do it depending on what you’re where you are, if you’re taking a test, typically they give you tables, and it’s an accounting test. If they’re not as nice to you, they’ll make you do the math. If the if you’re somewhere not taking a test, of course, you’ll have Excel hopefully, or, or a calculator to do this information. So the present value within Excel, what we’re going to do is we’re going to we’re going to do this two different ways. Again, we’re going to take the present value of the payment that’s due at the end of the four, four time periods or two years. And then we’re going to present value the interest. So to do this, where if we have Excel, we’re just going to go to the formulas here. We’re going to do this by by rather than just typing in the formula by going to this insert functions, which will give us a formula box, I’ll make it a little bit easier, some descriptions, we’re going to type in present value, and then get present value. That’s what we’re looking for. If you type Present value the entire word present value, then you’ll still find the same formula. And that’s going to be the present value formula explains down here. That’s the one we want. So we’re going to say okay, and then we’ll just enter our data here. And it’ll give us some descriptions. As we go through each of these down here. If we click into this item, it’ll give us a description. But we’re just going to enter our data. So the rate is the first thing it asks for, we want to take the rate of 10%, because we’re looking at the market rate to present value this thing, and we’re going to divide it by two. So point oh one or point 110 percent divided by two to get the market rate for a semi annual period. And then we’re going to take the number of payments, which is going to be four. And that’s going to be the two years and we’re going to pay every every six months.
03:49
So we’ll take that and multiply it times two to get four periods. So that’s the most confusing thing here is we’re saying for periods, not for years. every six months, and therefore the yearly rate is not 10%, which is given, but 10% divided by two because it’s rate for every six months rate. And then we’re going to take the future value. That’s what this is. Now, the most confusing thing about this formula is that we use the same thing for an annuity, and for a present value of one. But it’s the difference between these two fields that we use. So we just kind of know, on the annuity tables, when we look at tables, we had different tables that we used. In Excel, we’re going to say this number here represents payments, how many payments we make. So if it were an annuity, as we will see, when we do the interest portion, we would put payments here. But in our case, we’re only making one amount at the end of the time period, one payment in our case at the end of the time period, but we’re really just trying to present value one amount. So in other words, we know the future Now we know what we’re going to pay at the end of four time periods or two years, it’s 100,000. That hundred thousand is the future value, because it’s the actual dollar amount at the end of four time periods. So we call that the FV, or the future value. So that’s this is what we have noticed that this is a required fields, because it’s highlighted, it seems like so it looks a little, it’s a little confusing to use this, whereas this is not highlighted. And therefore you would think it would not be a required field. But in this case, because we’re using the same kind of box for Excel to do present value of an annuity, or one, these two are the most confusing components.
05:39
So this is how we’re going to do this. We’re going to see the calculation it actually does it for us down here. And that’ll give us the idea, of course, that if there was nothing else going on, if we’re paying out 100,000 at the end of the time period, and there was no interest then we would expect to get 82,002 70 now for a market a fair market. transaction. So that would be the 82,000. Now, if we hit ok here, you could type this just in Excel, and it would look like this. It’s worth going through here and looking at this for sales equals present value, that’ll be the formula, and then brackets. And if we click on this item, it’ll give us the rate, which we had point oh, I mean, point one divided by two, or 5%. And then comma, just like it says here, and then we’re on here, number of periods, four, and then two commas what was going on there. That means that we’re skipping over the payment. Remember, we didn’t have a payment, so we could put a zero in there or just two commas that it’s nothing and then we put the negative 100,000 that negative just to flip the sign, that’s the only reason you have a negative otherwise it would result in a negative answer. So it has a positive answer, it would be negative, okay, so then we put the hundred thousand that gives us the 82. Okay, so then we have the present value of the annuity, which is this form this formula. We’re going to do that in Excel, same thing, we go to the same Place. But this time, we’re going to take the rate, same rate 10% divided by two, same number of periods for time periods. And then the amount that we’re going to pay is the 100,000 times point oh eight, the stated rate on the bond divided by two, because we’re paying it every six months, that 4000.
07:22
That’s how much we’re going to pay every six months. It’s not the future value, this time, it’s an annuity payment stands for payment. So we’re going to pay that each of those four time periods. That’s what this is saying. There is no we don’t need the future value or the type. So this is the trick between these two. This is the trick and knowing that the number of payments does not mean years but payments and knowing that the rate has to be the rate per period, not per year. Then we’re going to say okay, and then this will be our present value formula here. It’s going to get us the 14 184 which makes sense because we’re going to pay 4000 times, which would be 16,000. If we present value it, we expect an amount greater than 4000, less than 16,000. If we see the formula in this format, we get present value times the rate, point one divided by two. And then we’ve got the number of periods for and then the payments, we have this time 4000, we don’t have any future value or any type not needed. And that’s what gives us our calculation. So if we add up our components, then we’ve got the present value of the hundred thousand 80 to 270, the present value of the payments 14 184 or present value 96 454. Now we’re going to do this one other way that you could easily do in Excel just to give us a better idea of what’s happening here. We could try to present value each time period, which is an easy thing to do when using formulas in Excel. And it’s it’s gonna be something that hopefully makes it look a little bit different be able to see things from a different angle. So we’re going to put the number of periods here and we’re going to try to say What’s the cash flow happening, and then present value each time period. And you’ll see we’ll get to the same result here.
09:06
So we’re going to say that the bonds in period one at the end of the first year, there’s no cash flow happening, the interest However, at the end of period one, we’re going to pay 4000. Now, the period one is every six months, so after six months after the first period, we’re not paying back the bond, we are paying interest. So the total, zero plus 4000 is 4000. Now if we were to present value, just this 4000, not doing an annuity, but just present value each time period at the end of six months, we use the present value formula to present value one at the end of this time period, and we would bring that that would be worth 3810. If we did that for a period to six months later, one year later. Now, we’d say the bond still we’re not going to pay back any bond no cash flow there. We are going to pay 4000 at the end of year two again. And that means that the total Zero plus 4000 is 4000. If we were to present value this 4000, at the end of one year or two, six month time periods, it would only be worth 3006 28. This is easy to do with with a formula in Excel. So and then if we go in three, and it’s the same for formula, the present value formula, we can copy it down, we don’t even have to type it in there again. And then we’ve got the bond, we pay another 4000. So the total zero plus 4000, but this 4000, at three years, or a year and three time periods, or a year and a half, it’s only worth 3004 55. So of course the value is going down as the time period increases from time zero where we’re at now, and then period four.
10:44
Now we’re going to pay back the bond because at the end of two years, 100,000 is going to be paid back plus, we’re paying that 4000 of interest that we pay every six months. So total then 104,000. If we if we present value, this whole one Hundred and 4000, which is four time periods out or two years, it’s only worth 85,005 61. So if we sum this up, then we’re going to say the cash flow is 100,000, that we’re going to pay back at the end of the bond 16,000 that we’re going to pay in interest in dollars, a total of 116, which could be calculated here, or here to get that 116. And then the present value however, is the 3008 10 plus two 3006 28 3004 55 to 85 561, or that 60 or that 96,005 45. This is often a useful way to see it in Excel easy to do in Excel. When doing things by hand. However, you’ll note it’s more tedious for us to present value each year. It’s easier for us to present value the annuity portion using an annuity table and then present value, the bond portion that’s going to be due at the end The time period separately and then add them together. If you’re using Excel This is nice because you get to see the cash flow on a yearly basis and present value on a yearly basis. So again that the transaction is just going to be cash is going to go up when we record this we’re going to sell it for 96 for 50 for the bond goes on the books for the hundred thousand, the discount is the difference 3005 46 cash is increasing bond on the books, discount carrying value 100,000 minus the discount