
Corporate Finance PowerPoint presentation. In this presentation, we will discuss breakeven analysis, get ready, it’s time to take your chance with corporate finance. Break Even analysis includes our fundamental tools for making projections and predictions into the future. Now note, when we think about breakeven analysis, the fundamental calculation within a breakeven analysis will be the break even point. But when we hear breakeven analysis in general, you can think of it that as a more broad kind of perspective, to use some of these tools in order to think about projections into the future. So when you hear breakeven analysis, you’re typically thinking kind of projections, budgeting, future based analysis, as opposed to some financial accounting, which is typically going to be based on the past prior performance.
00:48
When we consider future performance, then we typically want to switch our mind over from thinking about the costs that we will be including particularly, obviously, in the income statement, from what we see on a normal income statement categorizing those costs by what they are used for, such as cost of goods sold, the inventory we use, or the utilities or phone expense, general and administrative expense selling expenses, what they consumed what we consumed resources in order to do in order to get and then think about it more in terms of the behavior of the costs. In other words, will the costs change in relation to changes in the sales volume. So as we sell more or less, what’s going to happen to those costs, so we want to switch our mindset. And that’s often going to be referred to as basically a broad perspective of a break even type of analysis, breaking our costs down into behavior, two primary categories, then being variable costs and fixed costs.
01:51
Now, I highly recommend working through this with practice problems, we’ll use a lot of practice problems in order to do this. If you’re familiar with financial accounting, if you’ve worked mainly with basically financial statements, then this will could very well be new, because we’re going to reconstruct financial statements in a way that’s going to be creating the cost, especially the income statement by behavior of costs, as opposed to what those costs are used for. That can feel kind of unnatural at first, but you will shortly and easily see if you work through the practice problems, how useful that can’t be for making predictions into the future. So the bottom line breakeven analysis, you can think of it from a broad perspective as including the entire kind of structure that we’ll be talking about breaking costs down into variable costs and fixed costs. And then thinking about the analysis related to that that cost structure, which is a lot more flexible, and allows us our minds to think a lot more easily about changes that could happen into the future, especially changes with regards to sales volumes, increasing and decreasing.
02:56
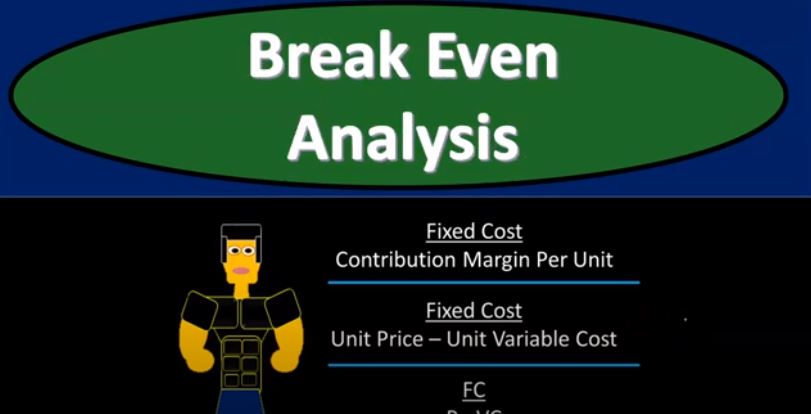
But then we want to think about the primary calculation that we will typically Britain have the breakeven analysis include, that is the break even point. So you want to consider the break even point that’s going to be our starting point really, for the kind of this break even analysis, the break even point is calculated as fixed costs, divided by the contribution margin per unit. Now, fixed costs may be something that’s new, we want to break down the categories to fixed costs and variable costs. These are not things that we typically see on a normal financial accounting. So if you just been making financial statements, you don’t typically break costs into fixed costs and variable costs, because those are cost structures based on behavior of the costs, how they behave with increases in decreases to sales volume. So you don’t do that a financial accounting, so it might be a new term.
03:43
And that’s also something that takes work for us to do. So when we start using breakeven analysis, we have to take all of our costs and rework them into this new structure, which takes time, that means that there is a time versus the benefit calculation that we need to do is it worthwhile for us to do this type of analysis. For most companies, it will be for most companies, this will be something that often been done internally. So if we are management, we will do this type of analysis. If we are something like an investor or something like that, we may want this type of analysis from a company if we’re like a bank, we may request some type of analysis that will be projections that will often use a break even type of analysis in order to get them.
04:24
Or we might try to break down the financials into more of a breakeven analysis standpoint, taking the standard financials and thinking about them in terms of the cost behavior, which means we have to consider or think about what it would be in terms of fixed costs and variable costs. So fixed costs and variable costs were typically you’re generally thinking the income statement costs, breaking them down to those costs that will not change with levels of production, like the rent, and things that will change as production level will change like direct materials labor, the contribution margin is going to be a new term as well. And you got to distinguish the contribution margin per unit versus the contribution margin in general. So it can be a little bit confusing to think about that you can break this formula down then into fixed costs divided by the unit price, what we sell each unit for minus the unit variable costs.
05:13
And this way, it’s going to be easier to see if you haven’t memorized obviously, this new term, which is the is the contribution margin per unit or the unit contribution margin, which is calculated as the unit price minus the unit variable cost. So now, if you break this down, you could start to see why this is really a useful type of calculation. Because if you have the fixed cost, let’s say the fixed cost is something like rent. So let’s say you have a restaurant or something like that, and you have a fixed costs, how much rent you have to pay for the place, or you’re going to have a dinner or something that’s going to happen, you have the fixed costs for the place that you will have the dinner in, then you’re going to say, okay, that that is what it is, I can put that on the top item here.
05:54
And then underneath that, we’re going to save then I charge for the dinner, or and that’s going to be let’s say $100 per person, $200 per person minus what it costs me per meal, and the cost per meal is going to be fixed, let’s say it’s $40 per meal. So if I take the hundred dollars minus $40, I’m getting $60 per unit. And you can see, we can see that this increased and will be a constant increase as we sell more tickets, we’re going to be increasing by $60. So that’s going to be what we’ll be increasing or keeping after simply the variable costs. And then once we see that we can say okay, well, then how many of those $60 chunks Do we need to be selling in order to pay for the rent, which, let’s say is going to be the 1200? Right? So then we could say, all right, well, what how many do I need to sell here in order to at least break even the 1200 divided by the 60, and we’d get the 20.
06:46
So we’d have to sell 20 tickets in order to break even. So that’s going to be a useful calculation. Now, you might say, Well, I don’t want to just break even I want to have a profit. But you can see this formula can be extended very easily to kind of project out how many units we would need to sell in order to calculate a profit. So we could say, well, if I have 1200, fixed costs to rent on the place, plus, I want to have a profit of you know, 2000, then I can say, well, this numerator now is going to be fixed cost plus profit gives us 3200. How many units do I have to sell, where I’m going to be coming away with $60 after the variable costs, so I can divide by the 60. And that’s going to give us the 53. In that case, this is a useful calculation, you can see how this can be very useful. But you might be doing this in practice. And you can say, well, it’s not so easy for me to be breaking out between the fixed costs and variable costs.
07:35
I mean, if you think about it, every costs has has a fixed or variable nature, it kind of depends on the timeframe that you’re looking at. That’s true to some degree, because we were artificially putting these into the category by behavior. And we’re doing our best to categorize these items. But if you think about it, in the long term, for example, fixed costs will typically to be variable in the long term, if you’re talking about rent, for example, yeah, it’s fixed in the short term, because I have a lease that I have to be paying. But if you if you expand backwards, and you think about it, from a longer term perspective, that lease will be up at some point. And then you kind of have the option right there, which you can think about it being somewhat variable at that time, or you can, you know, rent some other place as well with it or increase it in that way. So you can think about it saying, well, that could be kind of a variable item, it might depend on how in how high the sales volume goes, if it goes past some some point, then maybe we’ll rent some other place, and then you know, the fixed cost will be kind of variable. From that point, we’ll have a step up.
08:33
And those things are kind of issues, right. So we have to consider that when we use a breakeven analysis, because we’re trying to use kind of a linear perspective. And, and not all costs will be linear. But if we can break them into a linear perspective within within the timeframe that we are looking at, then it can be very useful for us to do projections into the future. Also, on the on the food, you might be saying, Well, yeah, you know, the cost of the food does go up per unit. But once I buy all the food, at that point in time, the cost that I have spent is pretty much fixed. You know, if I don’t sell as many tickets, and I already bought the food for it at that point, if I zoom the clock in, in that case, the timeframe, then it’s going to be fixed after that certain point. And that’s kind of true, right? Once the dinner is over, you’ve already spent the food costs and the food costs are basically fixed.
09:19
At that point, they no longer are variable. It’s not like they change with the ticket levels once you’ve already got the food purchase. But if you can predict them as variable in the point in time that you’re making the decision making horizon, then again, it’s going to be a useful type of analysis to have. So notice these things are we’re doing our best to categorize items between fixed and variable in order to make estimates into the future. It’s not a perfect world, and therefore the variable and fixed costs are going to be we’re going to do our best to to line those things up. You may also have some costs that are just naturally have a fixed component and a variable component to it. You may have like an electric bill. Word has a minimum amount that’s always fixed. And then it varies once you increase after some capacity level or something like that. And whenever we have a mixed cost or something, something that is mixed in some way, once again, we’re going to try to break it out into your fixed and variable component.
10:16
And we’re going to use different methods to do that as best we can, so that we can have this kind of linear relationship, because the linear relationship is going to help us to make really easy projections, it’s really easier for our minds to kind of think about what’s going to happen in the future and make really nice easy projections with it. Once we start to consider those projections, we might want to add more detail more complexity into work or cost structure analysis. So that we can we can, you know, drill down on the options that we have in basically more detail. Okay, you also might see the formula as this fixed costs over p minus VC for price minus variable cost. Just remember, if you see it in this format, you got to remember this is the price per unit. And this is the variable cost per unit. And you and you also might see it as simply fixed cost divided by the contribution margin. But remember that it’s really contribution margin per unit, because the contribution margin in total will be total contribution margin minus total variable costs.
11:12
We’ll talk more about that later when we get to a contribution margin type of income statement statement. Now, once you do this kind of analysis, you can see this and you might say, well, what if some of my fixed costs up top have to do with like depreciation or something like that, which is, is a cost but it’s not really a cash outflow? Right, I purchased something in the past. And now it was a equipment. And now I’m allocating the costs, which is a cost on the income statement, which I would typically include in the fixed costs here, because that’s allocating the cost of the equipment over the life that we’re using in, but we’re not actually paying the cash at this point in time, you might, you might then say, Well, you know, I’d like to limit my fixed costs up top here to those fixed costs that are actually cash outflows to make sure that I can actually cover the cash flow. So at some point, you might consider what’s the minimum, like, if I’m at risk here, what’s the worst case scenario for me to at least cover my cash flow.
12:09
To do that, we can then think about a cash breakeven analysis point where we’re in essence going to remove from the fixed costs, those costs that are not cash related. And then we’ll think about how many units we have to sell to at least cover the cash related fixed costs. So the cash breakeven analysis is going to be break even on a cash flow basis rather than on an accrual basis, which is basically the income statement for is usually on an accrual basis include things like depreciation, which is a cost, but doesn’t typically have the will not have the cash related to it in this period, they represent purchases in the past, useful to consider short term outlook, cash flow and solvency. So in notice that, you know, like we say that like that means like kind of worst case scenarios, right, the short term outlook, you know, the cash flow, that’s going to happen, can we can recover the cash flow, are we at least solvent here, meaning we can cover our cash flow, and then items expected,
13:07
I didn’t excluded when using a cash breakeven analysis include, we’re going to remove the depreciation because it’s not going to be a cash item, credit sales sales that are on credit. Once again, we’re going to remove those because we made sales, but we didn’t get the cash yet at this point in time in the short term. So you may want to remove those to think about your cash flow in the short term, if that’s going to be an issue. And then the credit purchases of material that we’re going to purchase on on credit because we didn’t pay cash yet. Again, if you’re looking at just the short term cash flow, then you may remove though the big one that we’ll take a look at an example is going to be the depreciation on equipment. Oftentimes, if there’s a big, you know, depreciation costs that are included, then that might be the one an item you exclude, well, we will work many practice problems on the breakeven analysis.
13:54
And we’ll have some on the cash breakeven as well highly recommend looking at those, when you’re considering the breakeven analysis kind of format, you really want to get good at setting up this items in Excel. And then using Excel so that you can change the data input, so that the whole worksheet will then change for you. So the more you do this type of analysis, you want to get good at setting up the Excel worksheet, because the format of this breakeven analysis is designed so that your mind can then think about possible scenarios in the future. It’s designed so that you can easily manipulate the numbers so that a lot to allow your mind to then brainstorm different type of scenarios. And then once you get those scenarios down to a certain point, then you might want to take those scenarios and think about them in a more detailed analysis that might be more detailed, but that’s that’s the point.
14:46
So to do that, you want to do that. You want to put this information into Excel in such a way that you can just change a few numbers, let the whole Excel worksheet then change based on this linear analysis. And then let your mind think about different different kind of objectives. brainstorm with different people and groups and be able to, you know, punch the numbers in nice and quickly to just brainstorm different options. And then and then get to more detail with it. That’s so Excel. great tool for breakeven analysis.