
Corporate Finance PowerPoint presentation. In this presentation, we will discuss the degree of operating leverage, get ready, it’s time to take your chance with corporate finance, degree of operating leverage. Now remember, when you hear this term leverage, there’s two things that pop into your mind that generally categories of leverage. The first one is probably related to debt debt leverage or financial leverage. And the other related to the cost structure, the one that we’re going to be focusing in on here, the structure between variable costs and fixed costs. So what’s going to be the structure of the variable cost fixed costs, that’s kind of what we’re measuring here, with the degree of operating leverage the fixed costs being the thing that’s going to have more leverage related to it.
00:40
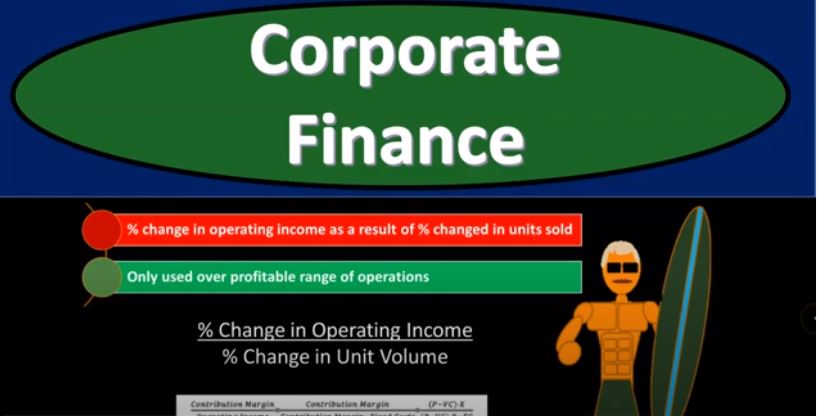
So if the cost structure is leaning more towards fixed costs, as opposed to variable costs, we will typically have a higher degree of operating leverage, that’s going to be the leveraging factor, remembering that that leveraging factor can amplify both in the positive or negative depending on the circumstances. For example, if the times are increasing, if we’re having increasing volumes of sales or decreasing volumes of sales, that’s going to be the leveraging factor we’re looking into typically the fixed costs versus the variable costs, we can measure that as a percent change in operating income as a result of a percentage change in units sold. Now, when we actually apply the calculation, we may use a different calculation, which we’ll talk about in a second, because that’s going to be easier to pull from one income statement.
01:25
Notice when we’re talking about the change in something, a change in income statement accounts, we have a timeframe that we’re gonna have to compare it to a timeframe, it would be nice if we can have a type of calculation that we can pull simply from the income statement. So we’ll talk about that in a second. So how does the percentage change in operating income as a result of a percent change in unit sold applied to the breakout between the variable costs and the fixed costs, you’ll recall that the operating income is going to be the income basically, before interest and taxes, we’re going to consider the operating income from operating Asians the net income, before we consider the deduction for interest, before we consider the deduction from taxes, if we think about how that operating income will change, well being compared to basically the sales or the units that will sell because as we sell the units, that means that the sales will go up at a constant rate.
02:18
So if we think about that rate of change of the units that are selling, as compared to the operating income, we’ll get an idea then of what we’re measuring, there is going to be a change related to those costs, that will change along with changes in the operating income, the variable costs, and the costs related to the fixed costs those costs that will not change. So as we as we have the units that we will sell changing, the sales will will change at a constant rate if we sell them at a constant price. And then we’ll compare that change to the operating income, which will change in different ways depending on the cost structure based on how many fixed costs we have, with compared to the variable cost, the variable costs changing as we fluctuate the sales volume, the number of units, the fixed cost not changing as we fluctuate the number of units.
03:07
So only used over a profitable range of operations, meaning if we have a negative income network negative income, then we’re not going to typically be using a degree of operating leverage formula. From there, we’re going to be using it from the positive point on upward. So our formula then could be represented this way percent change in operating income, divided by the percent change in unit volume. Now note that if we have a contribution margin income statement, which we’ll put together, when we start to work through these problems, we’ll start to put together a contribution margin income statement, a little bit different format than a standard income statement that you’re used to in financial accounting, something that is added work that you would have to do something to do internally within the company for this kind of projection analysis, which is quite common, or you’d have to somehow take the if you’re an external to the company, you would have to take the financial statements and do your best to estimate them in a contribution type of margin income statement for some of the calculations that we might be using in this type of this type of analysis.
04:09
So if we could do that if we can use this type of analysis, and breakout are numbers into a contribution margin, income statement type format, and income statement broken out by behavior of costs, how they behave fixed and variable costs, as opposed to a standard income statement, broken out by category, what those costs are used for the cost of inventory, selling expenses, admin expenses, then we can use a formula down here, which is going to be a little bit easier, there’s going to be a variant to get us to the same point, and that’s going to be the contribution margin divided by the operating income. So what is the contribution margin? That’s going to be the total variable costs minus the total fixed costs or you can calculate it as the price per unit minus the variable cost per unit times the units that we are going to be selling.
04:58
So this will be the contribution margin. total contribution, not margin, not the contribution margin per unit. So if you can memorize that contribution margin and what it means, then you could just write this formula easily as that being the the numerator, the denominator being the contribution margin minus the fixed costs, which is typically our operating income, if we have a multi step type of income statement. So in other words, it’s going to be the income before we consider the in the interest expense. And before we consider the income taxes, and you can also write that in a formula, this being the same contribution margin as we had up top minus the fixed cost this whole thing right here, minus the fixed costs, those costs do not change like depreciation, as we have a change in the sales volume. So this way up top is how I would think about it kind of conceptually, this formula, what is the operating leverage is the percent change in operating income, and the percent change in the unit volume. But in practice, if we have access to a contribution margin type of income statement, we’ll often use this formula, which should get us to the same result.
06:04
And it’ll be a little bit easier for us to apply typically, now, if you’re internal to an organization, and you have access or are able to create a contribution margin type of income statement, reworking the income statement to cost by behavior, then this is going to be useful if you’re external to the company, and you only have access to the financial statements that are provided by the company, then you might use this formula up top might be easier, because you might not have the information for a contribution margin calculation here. So if you can’t kind of work that out from the data you get from the normal income statement, and you’re not internal to the company, you’re external to it, and you’re just using the public financial statements, then you might be able to take two periods, and look at the change in operating income over the change in in the unit volume might be an easy little bit easier. Or instead of using the change in the unit volume, you can use the change in sales, which if you had a constant unit price, should be a similar relationship between the two.
07:05
So we will do many calculations and many problems based on this, we’ll put together a contribution type margin income statement, which I highly recommend taking a look at, you know, the standard format for that will mainly be using this calculation down here with our contribution margin income statement. And then we’ll we will have a practice problem showing this calculation, as well highly recommend working through those practice problems in Excel, ideally, but we’ll also do them in one note, kind of presentation formats as well. So the degree of operating leverage limitations, what are the limitations to it, it exudes the existence, it assumes the existence of a linear function for revenue costs as volume fluctuates. So we have to in order to do this kind of simplified type of analysis, the criticism on it is that, hey, look, in the real world, you don’t have this complete linear relationship, that you’re projecting out in this format. And that’s true.
07:56
And you’ll run into people on both sides of this argument that are very adamant about their position, some will say, Hey, we need to have some simplification in order to for us to make some decision making process because it’s too complex of a process for us to make decisions and run different kind of analysis, if we don’t assume some kind of like linear type of analysis. And others will say, hey, you’re simplifying things down to the point where you know, what your analysis is coming up with makes no sense, because that’s your you’ve oversimplified and you’ve lost components that are significant within the decision making process. So whenever we think take something and look at projections into the future and do an analysis like this, then our tendency is going to be hailed the world is too complex for us to for our brains to be able to think about different types of scenarios and be maneuvering around all these different complexities. And therefore, we have to develop a model that’s going to have some kind of simplification to it.
08:49
But whenever we do that, we have to understand those simplifications that we have used those simplifications in order to jog our minds, to think about different ideas, and then possibly put in more complex models when we limit our decision making process down to a point where we want to spend the time to put more complex models based on you know, those decision making processes. But there’s always going to be this problem with this type of analysis is that you know, you’re going to Britt, you’re oversimplifying in order to make decisions, or you or if you don’t over simplify your models way too complex. In order to consider different different type of analysis. There’s got to be some balance between the two