Comparative Profit & Loss 3.20

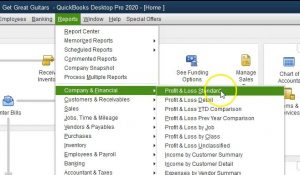
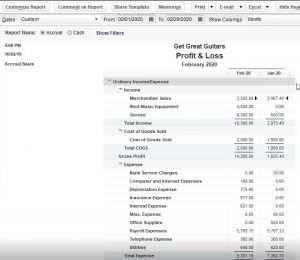
In this presentation, we will create a comparative a profit and loss report from a profit and loss standard report within QuickBooks Pro 2020, QuickBooks desktop 2020. Here we are in our get great guitars file, we currently have the open windows open, you can open the open windows by selecting the view drop down up top and go into the open that windows that list, we’re going to be starting off with the profit and loss standard report, we will then go to the reports drop down Up top to open that up and go to our favorite report one of the two favorite reports being the profit and loss standard in the company and financials within will change the dates up top the dates are from a one a 120 to 1230 120.


0:43

This is going to be the report we’ve been working with thus far, we’re going to now do a comparative profit and loss. And we’re going to be comparing simply the January and the February rather than the entire year. So we want to compare January and February. The first thing we can try then is to adjust the date range from January to February. So January 202 29 to zero is going to be 29 days in February 2020. So if we have that, then you can see that it doesn’t do a comparison, what this will do is create a profit and loss reports for a two month time period both January and February.


1:18

Recall that the profit and loss report means that we’re going to be entering data for a time period it needs a beginning and an end. In other words, in other words, it’s going to tell us how we did over some period of time. Therefore if we select two months of a time of range, it’s going to tell us how we did over that two month time period. In other words, income will be accumulating upward for the two month time period as well as expenses. And the net income will be the difference of the two. Now the one way that we can think about well, how can we break this out, because what I really want to see is how we did for the month of January, that accumulation of January 1 through this January 31.


1:56

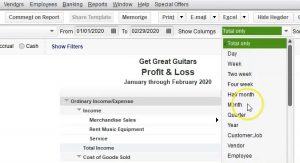
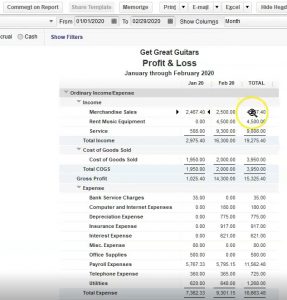
And then February, February 1 through February 29. One way we can do that is we can go to this drop down here. And we want to say let’s go down two months. So if I change that two months, now we’ve got January in February, and then the total, notice that it now gives us the total as it was not given in the balance sheet. Because the balance sheet is as of a point in time, if I ran the same report for the balance sheet, we wouldn’t have a total column because we wouldn’t be adding up the two time periods because it would be as of the end of January, as of the end of February.


2:29

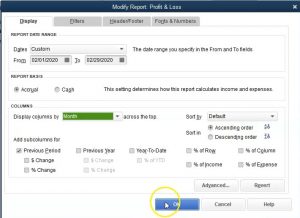
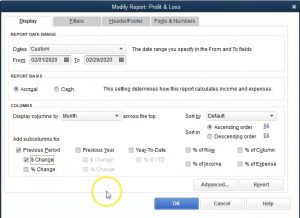
The end of February is the total as of the end of February. As of that point in time here. However, we’re saying how much did we accumulate in revenue upwards? In January? How much did we accumulate upwards in February? And then how much did we accumulate between both January and February giving us then the total. So this is one way that we can see this? Obviously, we have the January 1, and then February we’re reading left to right, oldest to newest. And so what how else can we see this, we can go up top into the customized reports up top, we can also say Well, why don’t I want to use this previous item here, as we saw on the balance sheet. If I want to use the previous period format, then what I need to do then is select just the current month. So I want to select the current month, which is going to be Oh 20120.


3:20

Now note that you want to keep it on months down here as well, because if you were to change it to totals, then it might see this just as basically 29 days, and I would like to have it for the month. And notice this could be a little bit tricky, a little bit different. When you go to the QuickBooks Online to buy they’ll have the similar kind of format for it. So I typically keep it with a month then. And then I want to look at the previous period.


3:43

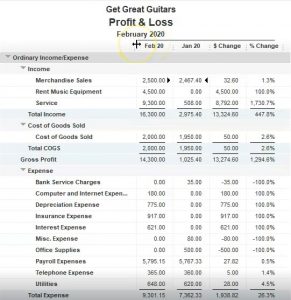
So we’re going to select a month, the previous periods were in the current of the second month, then we want the previous month, which would be January, we’re going to then say okay, and you’ll see now then it does the same thing. However, this time, it puts February 1 and then January. So now we have February and vengeance worry, we don’t have the total column. So that’s going to be the major difference on the profit loss type report. If you want the total column, if you want January in February, and then the total summing them up between the two, then you can use basically just simply the months calm.


4:15

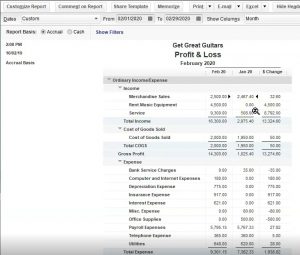
If you want then the other the current month first, and instead of the total, the difference between the two, how they did between them, then we can go to the customized reports and say I would like to see the dollar change, and then say, Okay, so now what we have, instead of it totaling up the performance over the two month time period, it’s comparing and contrasting how we did in the one month to the other month.


4:40

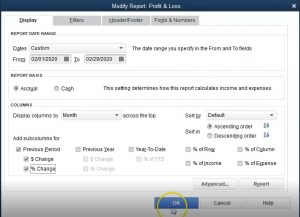
And so obviously the change is the difference. And we can compare out how we did from one to the other, then we can also have the percentage change by going up to the customized reports up top, we then wanted to take a look at the percentage change percentage change and say, Okay, so now we have the percentage change. If we were then to consider percentage change, it could be a little confusing to think about the percentage change, it’s just going to be the for example, if I took the total income, the 1630 minus the 297 5.4, that’s the dollar change, we’re going to take that change and divide by the previous month, in this case, January of 297 5.4. Now if I move the decimal two places over, that’s going to be a 447.8 increase, which is a pretty nice increase, but it’s the first year of operation. So funny things happen in the first year of operation. So that’s good.


5:36

That’s how you’re going to calculate the increase and the decrease. Now we’re going to do some formatting with this. Now, you’ll note of course, is not just a profit and loss will not going to call it a comparative profit and loss. It’s not simply for the month of February, but now January and February. So let’s change those items. And I’m also going to remove these these items up top.


5:56

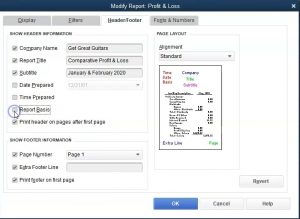
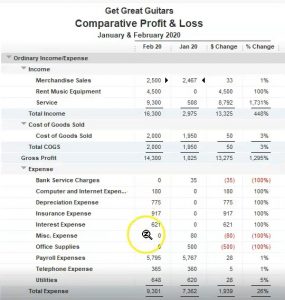
So we’re going to go to the customized reports, headers and footers, we’re going to say that we want this to be a profit and loss, let’s just call it a comparative comparative profit loss. You could call it a comparative income statement, if you think that the readers of your financial statements would prefer that terminology. And then we’re going to say January and February 2002, and 20, then we’ll remove the date prepared time prepared and reports basis, that will remove these three items, then I’m going to add the footer, which I’m just going to call Smith, CPA, that’s going to let the name of our firm will put on the footer, and then we’ll say okay, then if I was to see that footer, we can go to the print option up top and report, then preview. And then here’s our footer down below.


6:48

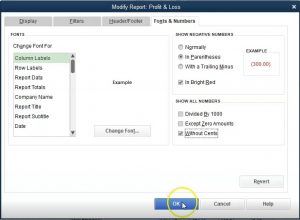
If I zoom in there, there’s the footer, I can close it out here, I can close it out up top here. And then I’m going to close this back out. Now I’m going to do a little bit more formatting, I’m going to remove the pennies on it, we’re going to make those negative no red. And with brackets as opposed to just the dash, we’re going to do that by going up to the customized reports up top, we’re going to go to the fonts and numbers, we’re then going to change the parentheses here, we’re going to make them read if the negative number, we’re going to remove the pennies, and then I’ll say, okay, so that cleans it up a little bit, we got the red numbers in there, we have removed the pennies for it, then I’m also going to change within the categories to have the highest number of top in the category.


7:31

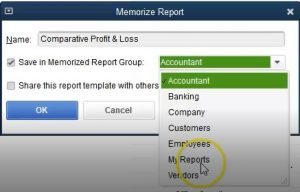
So I would go to the sort by, I want to have the totals. And then I want to put this in descending order. So totals a down to z. Now within the expenses, we have the descending order here. So this is what it looks like so far. Now I’m going to go ahead and memorize this report. So we can put this into our memorized report. So we’re going to go then to memorize. And then we’re going to put this into the it’s called the comparative profit and loss that looks good. We’re going to put it into save in memorize, I’m going to put this into our custom location, which is going to be in the my Reports


8:06

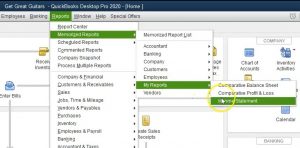
section within my reports. And then, okay, yeah, it takes a little picture, if you have the audio on it, I’m going to close it out and then open it back up within my reports in the memorized reports, closing it out here. We’re then going to go to the reports up top, we’re going to go to the memorized reports. And then we want to go to my reports, which in this case, now we’re looking for the brought the comparative profit and loss. Here it is comparative profit and loss, we’re going to open that one up, there it is.


8:35

Now we’re going to go ahead and save this in a couple of different formats. We’re going to save it as a PDF file. And we’re going to print it to we’re going to save it in our Excel document that we have been creating for all the reports. And then we’ll use that to create one PDF file with all all of the reports we’ve created thus far. So to do that, we’re going to go up top, we’re going to go to print. This time, instead of printing using the cute PDF printer, I’m simply going to go to save as PDF. So we’ll save as PDF, it’ll then open up here, I like to put this right under the name. So I can just go to it and put the name down below. And the name is going to be a comparative, I’m just gonna say comparative, P and L. Just going to go 2020. And so I’m going to save that, then we’re going to export it.


9:26

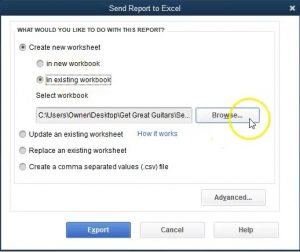
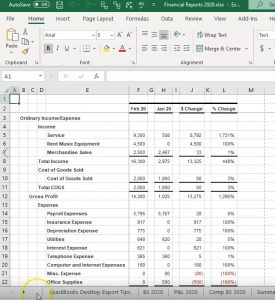
So I’m going to export it up top to create a new worksheet to the new worksheet, it’s going to go to an existing workbook, if you don’t have a workbook open, you can just create a new one here, but I’m going to go to the existing workbook we’ve been working on, we will browse to locate that workbook, it’s going right where we want it because we’ve been going there a lot lately. So we’re going to go into the financial reports 2020, double click on that and export to it. Here we have it, we got the same kind of weird stuff going on that we got to clean up within Excel.


9:56

So I’m going to go all the way to the left one, it’s going to be this new tab, I’m going to get get rid of his new tab by clicking on it right clicking on it, and then deleting it, so will delete that tab, then I’m going to go back on sheet one, I’m going to drag it to the right because it kind of put it in the middle here and I’d like to put it to the right, so I’m going to left click on that sheet, drag it to the right, then we’re going to do the cleaning up of the split pains.


10:21

We’re going to do that by going to the page layout to view I’m going to click on the Page Layout View, I’m going to say okay, then we can see the splits here, I’d like to get rid of those going to do that by going to the View tab up top, we’re going to go into the windows group, we’re going to split the pains and split the pains please. And then we’re going to rename it while we can see the name up top. So the name is going to be if I double click on the tab down below, it’s going to be a comparative P and L compare the P and L, I’m going to go back to the normal view.


10:52

Now back to the normal view. Now we’re going to save this document with all of these files located within it. So all of these files, were want to save them all in one PDF file that we can then send to someone. So we’re going to go back up top or and go to the File tab, we’re going to go to the print option. We’re then going to say I want to print the entire workbook, not just this worksheet, but the entire workbook, we have the entire workbook. And then we see we have seven pages.


11:18

These are the seven pages as we scroll through them. They all look Excellent. So now we’re going to go ahead and export this, I typically would use the cute PDF printer, I’m going to select the drop down up top, go to the cute PDF printer, and then I’m going to print it. So we’re going to print it, it’ll then give us our option to locate where we want to put it minds can be in Section four, I want to overwrite this financial report right there. So I’m just going to say Save to that. Yes, and it’s going to overwrite that report, then we can take a look at what it looks like. So I’m going to open it back up. And here we have it, we’re going to be in second one through four.


12:02

This is how we can provide this information to a client supervisor or our sales or whatever we have within the financial, we could give all of these saved as PDF files, which is given kind of tedious. You can imagine the filter all attached to an email to you that you can kind of like adds a lot of lot of stuff. I don’t know if I want to open it. And then we have the we could zip it so that we could say okay, well here’s at least zip I’m going to right click and zip it. So that we provide just that zip file attached, that could be a little nicer. Or we can give the Excel file if someone is okay with an Excel file, or we can get this PDF file that we created from the Excel file which has all the reports to it, which at least would be easier to have one attachment right so we got the the balance sheet we got the profit and loss that we created.


12:51

We’ve got the competitive balance sheet. Now we’ve got the end of the comparative balance sheet, we got the summary balance sheet, we’ve got the income statement, we’ve got now the comparative Profit and Loss report. We can provide all that with one document in this format.


Custom Income Statement 3.15

This presentation and we will create a custom income statement from a profit and loss of standard report within QuickBooks Pro 2020, QuickBooks desktop 2020. Here we are in our get great guitars file, we currently have the open windows open, you can open the open windows by going to the view drop down up top and selecting the open windows that list, we’re not going to be taking a look at our income statement or our profit and loss report.

(more…)

Memorize Reports to a Custom Group 2.50

In this presentation, we will memorize a custom report to our custom memorized report location within QuickBooks Pro 2020, QuickBooks desktop 2020. Here we are in our get great guitars file, we currently have the open windows open, you can open the open windows by selecting the view drop down up top and go into the open windows lyst. Now we’re going to be creating a report, we’re going to save that report to a specific location for the memorized reports.

(more…)

Create a Memorize Report Group 2.45

This presentation we will create a memorize reports group where we can store and save our custom reports are memorized reports to within QuickBooks Pro 2020. QuickBooks desktop 2020 is our get great guitars file, we currently have the open windows open, you can open the open windows by selecting the view drop down and the open windows lyst. We’re not going to be considering the memorization of reports very useful to have the memorization of reports it can have different types of functions to it.

(more…)

Summary Balance Sheet 2.40

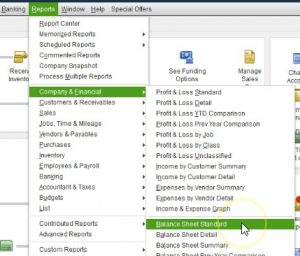
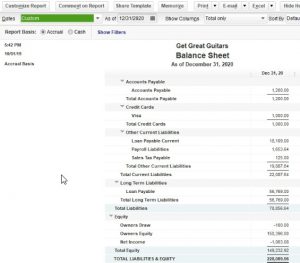
This presentation we will generate and analyze a summary balance sheet comparing and contrasting it to the standard balance sheet or balance sheet standard report, which is going to be the general balance sheet that will be generated when a balance sheet is created, we will do this within QuickBooks Pro 2020, QuickBooks desktop 2020. Here we are in our get great guitars file, we currently have the open windows open, you can open the open windows by selecting the few drop down up top and the open windows lyst, we’re going to first create actually our standard balance sheet so that we have something to compare the summary balance sheet to so let’s first create this standard balance sheet.


0:36

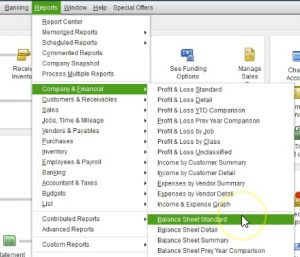
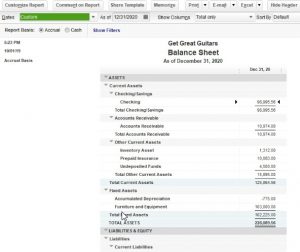
As we have seen in the past, we go to the reports up top, we’re going to go to the company and financial scroll on down to the company to the balance sheet standard. Here is the balance sheet standard Report, I’m going to change the dates with the customized up top, we’re going to change the dates from a one a 120 to 1230 120, that’s January through December 2020, then I’m going to say Okay, so here’s going to be our balance sheet report. Now you can see that this is a fairly long report, it’s got a lot of sub totals to it. And a decent amount of accounts that will vary, of course from company to company.


1:10

But this is the standard report that we would want. Because typically we want to see those accounts when we’re going back and forth from the data. Because oftentimes, we’ll want to use the auto zoom feature to go into that detail. However, when we give this report to somebody else, we may not they may not want the detail, especially if you’re talking about someone that doesn’t have a lot of financial accounting information, or they don’t work with financial statements a lot, then or even someone that does that just wants the bottom line, they might just be a bottom line person, I just want the sub totals, I don’t need all the detail, then we may not want to provide that.
 

1:44

So most people that work within QuickBooks will then always be going back and forth to this report as they enter data to see what happens to the particular accounts, either here or to a trial balance report, which gives all the report detail details basically the reports that will be on the list of accounts or Chart of Accounts. In other words, if we go to the lists drop down, and we take a look at the chart of accounts, if we were to generate the standard balance sheet and the standard income statement, or Profit and Loss report, all the accounts here that have a balance in them for that time period would then be displayed on it. Not so with the summary report. But that’s very useful.
 

2:22

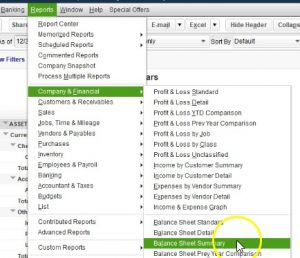
When we’re going back and forth from the reports I just close that out, we’re back to the balance sheet balance sheet report here. Now let’s compare this to the summary report, which is something that’s going to be given by QuickBooks will go to the reports drop down up top, we’re going to go to the company and financial will go down to the balance sheet area, this time choosing the balance sheet summary report, balance sheet summary report, then we’re going to go back up top to the same kind of change to the customized report. And notice you have similar fields up top as we do with adjusting the reports as you will with most reports, we’re going to go to the customized reports.


2:56

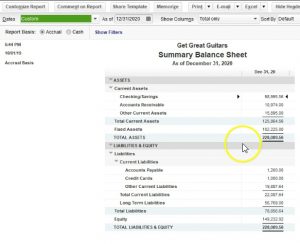
We’re going to adjust the dates from Oh 10120 1230 120, that’s January through December 2020. And okay, and you can see it fits nicely basically on one page. So what do we have here, in this report, we’ve got the checking account, that’s basically the account type, we’ve got the accounts receivable, again, in essence, the account type, we have the other current assets, the account types, what do I mean by that? Notice, if I go to the lists drop down here, we go to the chart of accounts.


3:27

These are the types so whenever we set up an account, we have to set it up as an account type. The account types will typically be in order of assets, liabilities, and then equity, and then income and expense on the profit and loss statement that and then they are further broken out to cash accounts or checking accounts, or bank accounts here. The accounts receivable, other current assets, these are all in the asset category, fixed assets, and and so on. These account types are basically what’s creating the summary report. In other words, going back to the summary report in the open windows, they’re basically grouping by account type. So if we had multiple checking accounts, we only have one in this case, but if we had multiple checking accounts, then they the multiple accounts would be shown here.


4:13

If we had multiple accounts receivable, then they would be grouped together, they wouldn’t be showing they’d be grouped together here. The other current assets had multiple things in it and they’re grouped as just one line item on the account types, we get a nice clean, total current assets then, and then the fixed assets once again grouped together, we have depreciation and the fixed assets here given us the total assets, and then down below same with accounts payable, we only have one of them, and we had multiple, which is unusual. But if we did, if that was the case, it would be grouped together credit cards same. And then we do have multiple accounts for the other current liabilities, we have the subtotal then for the total current liabilities, then the long term liabilities those over a year.


4:55

And that gives us the total liabilities. And then finally, equity. Once again group together, we don’t see draw, we don’t see net income, that of course, our assets equal liabilities plus equity, you can see how much cleaner This is, if you were to look at it considered that this report as opposed to the full balance sheet report. Therefore, what you really generally want to do is you want it when you go into a meeting, if you’re talking to a client, or if you’re talking to a supervisor, or if you’re talking to anyone investor in something like that, you probably want to print the summary report first. And then and then you say, Hey, this is the bottom line numbers.


5:29

That’s the summary report, then you predict what they’re going to ask if they want more detail. Because most of the time, even people that are bottom line people, they say I just want the bottom line, just give me the summary report, and then you’ll give it to them. And then clearly, they’re going to say well, now I’d like to know more about this, or that right. And then you’re going to be ready for that with the more detailed balance sheet report. So give them the summary. And then if people are easily overwhelmed by numbers, hopefully that’ll be as easy as you know, as summarized as you can make it or if you if you deal with someone that wants to just get right to the facts, then they can they can do with that.


6:01

And then just expect of course that more detail will evolve after the conversation goes forward, then you can go to the standard balance sheet report. And then on further details within the account, you know, balance details from that point. Now, when you’re working and putting in data input, you typically won’t use this report because you can’t use the zoom feature as easily. For example, if I was to zoom in this other current asset report like double click on it, then it’s not going to go into one account, it’s got these multiple accounts that are in that are making up that number. So that makes it a little bit more difficult when I’m entering data to a particular account to go back and forth and review the information to that account. That’s why most of the time, most people are most familiar with the standard balance sheet report because as you enter data input, it’s nice to go back to that report. And check the numbers as you do so as we will do when we make it when we make data


6:53

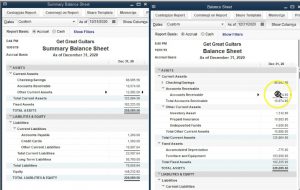
input. I’m going to close this back out. Let’s do a side by side comparison within QuickBooks, which is kind of nice to be able to do, I’m going to maximize the screen. So see this little icon up top, we’re going to select that, and that’ll that’ll make it so we can kind of adjust this window within QuickBooks. So we can adjust this window in here, then if we go to the standard balance sheet, we can do the similar option.


7:18

So it would either be maximized, or you can on maximize it. And then we can maneuver this around like a like a normal windows program, we can put these in a side by side comparison, and see if we can adjust this a little bit nicer. We’ll make this as small as we can, and do side by side here. So then you can see side by side, if we have the checking account, you can see here that I could collapse these and in essence get the same report right? There’s the checking numbers, we only have one of the accounts receivable, if I compress that there’s the accounts receivable, here’s all the things in the other asset accounts, which are making up that 15. If I collapse that account type, then there’s the 15, there’s the total.


8:08

Then if I go to the fixed assets here, here’s the fixed assets. If I collapse the fixed assets, there’s the fixed assets here, we scroll down to the liability side, we’ve got the accounts payable only one thing in accounts payable, if I collapse that there it is, then the visa, we only have one Visa card, if I collapse that there it is. And then we have the other current liabilities. And that includes multiple accounts. If I was to collapse them, it would show them in one account as we see over here. And then we got the total current liabilities and then long term. So if I collapse the long term, we’ve got the 56.


8:42

There we go there and then the equity. So if I was to collapse the equity, then we get the equity section and then the totals down below. So you could see it that’s you know, the comparison between the two reports. If I then maximize the summary report, we’re now going to save it as a PDF file. And then we’ll export it to excel an Excel file that we have already set up and then use that Excel file to print out all the reports we have so far to one PDF file. So I’m going to go up top, we’re going to go to the printing options, we’re going to print the report. And we’re going to use the Q to PDF printer.


9:16

So that’s the one we want. So I’m going to go ahead and say print here. And then we’ll have our where do we want to put it, and we are in section one. So this is the place, I’m actually going to put it into the financial reports folder. However, I like to put this right under the date. And then we’ll change this we’ll just call this the summary, let’s say balance sheet, and this is 2020. I’m going to go ahead and save that. Now I’m going to export it to excel and existing workbook that we have set up for the section we’re going to go to the Excel, create a new worksheet, and then we’re going to put it into an existing workbook.


9:59

Now if you don’t have and existing workbook, you can just create a new one, we’re going to choose the existing workbook for our example, we will then browse to locate that existing workbook. We’re in section one, this is the workbook that we had set up, you can click on it and open it, I like to simply double click on it. So I’m going to double click on it, and then I’m going to export to it. Here we have it, we’re going to do our normal kind of adjustments, that will typically happen, we’re going to have this new sheet popped up.


10:25

So I’m going to get rid of Adam and and go to this new sheet, I’m going to right click on it and delete it. Say Okay, and then here’s our new sheet that we have export it to it, I like to pull this all the way to the right, so I’m going to grab it, and I’m going to pull it all the way to the right. Now note, you know, you might want the summary to be first, right, you might want the summary balance sheet and then the standard. But I’m just going to group them as we have reported them and looked at them in this report. So how you want to group these is you know, you


10:51

have to think about that how you’re going to package your information together when you present it. So then we’re going to say go to the splits. So we can to the Page Layout view so that we can see the splits. And we’re going to say okay, and then up top, I’m going to go to the View up top, we’re going to go to Windows within Windows, I’m going to uncheck the splits. So there now we can see our information there. I’m going to delete this item here, which we could have done in Excel. And then I’m going to go down and double click on the sheet, double click on the sheet.


11:23

I’m going to call this a summary, balance sheet 2020. And there we have it, I’m going to go back to the normal view. And there’s this. Now we have all of these reports here. So I’m going to try to print all of these reports on one PDF file. So we have the balance sheet, the p&l competitive balance sheet, and now the summary balance sheet. If we go to the File tab up top, we can then go to the print option.


11:49

Within the print option, I’m going to select the entire workbook. So we’ll pick the entire workbook, it’s going to the cute PDF printer, we now have five pages scrolling through those pages, they look like so. So now we’re going to go ahead and print this report. It’s going to print to the PDF printer. So here’s our dialog box, I’m going to go back to section one folder. And I’m going to just overlay this this file here I’m going to say save. Yes. And there we have that.


12:21

Let’s take a look at what we have then so far. So if we open up our section one folder, we then have the the Excel file here that we can provide to someone that provides all the documents, we could then give them this file, which is now getting kind of long, we’ve got four documents within it, we could attach all of these separately to an email or we could zip it, I’m going to delete this zip file, we could zip this file, right click and send to a zip file and send it here. Or we can simply send this one PDF file that we created from the Excel document that has the four reports in it, including the balance sheet, as we see here, the profit and loss report, the comparative balance sheet, and then the summary balance sheet. So those are some ways that we can summarize this data provided to someone else or save it in our files.


Comparative Balance Sheet 2.35

0:00

In this presentation, we will create a custom competitive balance sheet report, we will create it from a balance sheet standard type of report. Once created, we will then print it as a PDF file and export it to excel, we will be doing this within QuickBooks Pro 2020, QuickBooks desktop 2020.

0:20

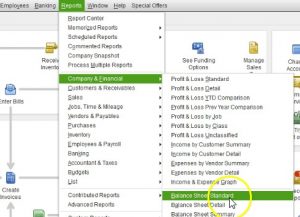
Here is our get great guitars file we currently have the open windows open, you can open the open windows by going to the view drop down and selecting the open windows list. We’re going to start off by creating a balance sheet a standard report generating a balance sheet standard report we will do so with the reports drop down Up top will go to the company and financial we’re going to scroll down to our familiar and our favorites and balance sheet standard report.


0:44

Before I click on it, however, just note that we do have a balance sheet of previous year comparison, if it was a year to year comparison that we can do, we’re going to be doing a month to month comparison, we’re going to be altering the standard balance sheet report. And as we do so we’ll get used to the flow for altering airport. So we’re going to go to the balance sheet standard report. Here is our standard report, we’re going to change the dates, I like to change the dates up top in the customized reports. So I can choose the relevant field that I would like the range. So from a one on one to zero to 1231 to zero, that’s January through December 2020.


1:20

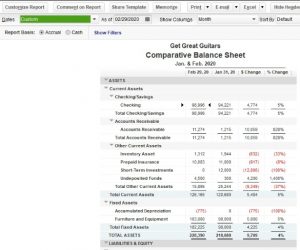
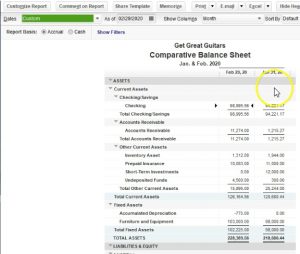
Now we’ve looked at a few of these options we were gonna we were going to use now in a previous presentation, when we looked at the options for the customizing the reports, now we’re going to apply that customization option to make it a competitive balance sheet, what we want to end up with is a comparison of January in February of 2020, we’re also going to have the change and the percentage change involved in it, then we’ll do some further customization to it, including removing the pennies and removing these items over here and adjusting the heading. So that is no longer simply a balance sheet as of this date, but a comparative balance sheet, and therefore we need to change the date and the title.

2:04

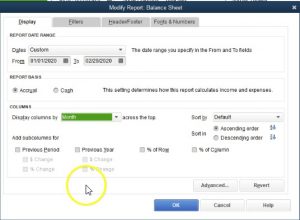
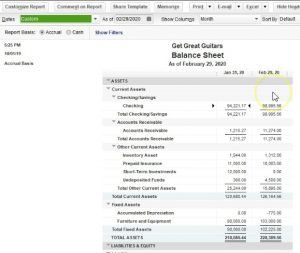
So to do that, let’s start off with a comparison, we’re going to go up top to the customized reports, we’re then going to be in the display options, a couple different ways that we can do a comparison, our goal, our objectives, recall is to have January in February, two months, that comparative of two months, January in February. So we could then say let’s try Let’s choose the date range and make it to the correct date range, right, we could say let’s make the in day 202 29 to zero, there’s 29 days in 2020. And then let’s go down and change the display columns to the months in by doing just a month, then it’ll pick up those two months. So I’m going to say okay, and there we have it and January in February.


2:47

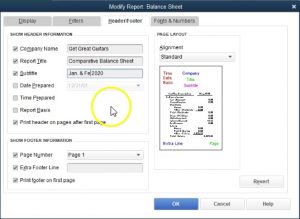
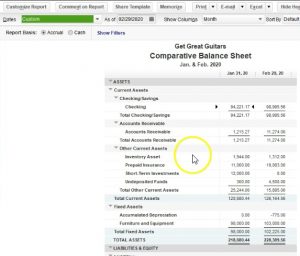
So that’s one way we can do kind of a comparison. Once that is done, then we would want to go up top and adjust the title. So we’d want to adjust the title and when the date is now wrong. And oftentimes we want it then because the date should January February, not as of one point time as a February 3 29th. And we can remove these items here. So we’re going to go up to the customized reports, we’re going to go to the header and footer. And I would typically remove the date prepared the time prepared that report basis. And if we select OK, we have not removed these items, then I’ll change the title, we’re going to go to Customize reports. We’re going to go then to the header and footer. And we’re going to change this to I’m just going to add before the balance sheet and the report a comparative balance sheet. And then for the dates, I’m going to say January in February. So let’s say,


3:44

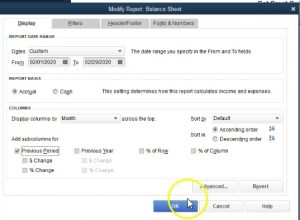
Jen, let’s just abbreviate January, and February, and 2020. And then if I say okay, then we can have a more customized report up top in terms of that if I go to the customized options, again, the other way that we can with this, if I go back to the display options, if I want to see a comparison, and then the difference or change between the two months, you’ll recall that’s going to be with these previous options down here.


4:12

So instead of basically using the month as the factor that will be used, I’m going to go back up top and go back to the total. And then actually, we could keep it on the month, I’ll keep it on the month. And then I want to use the previous month someone that means that I have to be in the current month, not the full date range, not the two month date range, but just the first of the second month, oh one to zero.


4:36

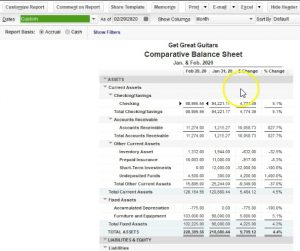
So February 1 through February 29, just the second month, I’m going to keep the months down here instead of the total. Because if I have the totals, then it may not pick up the fact that I’m talking about a month in that in that case, it’ll it’ll, it could throw things off, if given the fact that the month don’t have the same amount of days in them. So if I select a range that is 30 days in the next month is less than 30 days, then it could mess up the range. So therefore I will keep this on the month. And then I want to have the previous period, which QuickBooks should read then as the previous month, not the previous 29 days. So if we select that, then note what will happen on the change here, we had January 1, then February, this is a way that we can have a similar report, but February 1, so I’d say okay, we have February and then January.


5:29

This is a common way to see the report. Because oftentimes, if someone’s glancing at a report really quickly, they’re going to say what’s most important, the recent data, and that’s what they want first, possibly, and then if they have time, they’re going to go to the prior data, which is going to be to the right, so they can read left to right. And this way important to less important. Back to the customized reports, we will be adding the change in dollars and change in percent, as we’ve seen in a prior presentation. So we’re going to say Okay, so then we have it, this is what we have so far. So and we’ve seen these change in dollars and change and percent in a prior presentation.


6:07

So I won’t spend a lot of time on it. But just note, of course, we’re talking about the change between the columns from one year to it from one period to the next. And this case, from February in January. Notice we are taking on the entire month in this case. And so the the number of days then is not exactly even because we’re taking on the entire month. And then we have the percentage change the percentage increase and decrease very valuable column. When we’re comparing to other things like other companies to see what how they’re progressing. The percentage change is very useful in those cases.


6:41

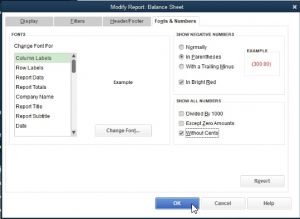
Let’s go back and make a few other adjustments, I’m going to remove the pennies, we don’t really need the pennies in the report. So I’m going to take those out, I’m going to go back up to the customized reports up top, I’m going to go to the fonts and numbers within the fonts and numbers, I’m going to display the next it is with parentheses, I’m going to make them read. So make them read, then I’m going to remove the sense going to remove the penny. So we no longer have to see the pennies. And that should clean this up a bit. If we close this out, I’m going to say save.


7:15

There we have it. So now it’s a little bit a little bit nicer or easier to look at the pennies aren’t adding a lot of value with the with the analyzing of the reports. And then we scrolling down this is what we have so far, this is what it looks like at this point. Now this is a new report we haven’t generated yet. Therefore, I’m going to go ahead and save this in our section one folder. So I’m going to save it in a couple different ways. I’m going to save it first as a PDF file, and then we’ll save it as to the Excel document that we can then use to create another PDF file with multiple documents within it. So I’m going to go ahead and save this.

7:50

And we’ll go to I use the print up top, I’m going to use the cute PDF printer. So I’m going to print it to the cute PDF printer, which is going to be making it printing or a PDF file as opposed to printing it to an actual printer. And I’m going to say print. And then it’ll give us the printing options. Note Of course, you don’t need the cute PDF printer do this, you could save it as a PDF. But I think it’s good practice to use this cute PDF printer, or some other type of PDF printer. I’m not advertising that particular one. But something that has a PDF printer for it can be useful. I’m going to then go to the desktop.


8:29

And we will find our folder get great guitars, we’re going to put this into section one. And then I like to be able to just align this right under the title. And say that this is going to be the I’ll just abbreviate it a bit comparative balance sheet. And I’ll say Jan, and fed 2020. So we’ll save that, I’ll save that. And then I’m going to export it, I’m going to export it to an Excel file that we have already set up previous in this section.


9:05

So I’m going to export it to an existing Excel file. If you haven’t seen the existing Excel file, you can export it to a new worksheet if you so choose, if you want to follow along, I’m going to go to the export f stop or Excel up top and then go to create a new Excel worksheet. It’ll be a new worksheet, but the in the existing workbook. So here I want to put it to an existing workbook that we have created in a prior presentation. So if you don’t have another workbook, you can just create a new workbook here. And then we can go to browse. And this is the one I want, I believe, let’s just double check that. Yeah, I think that’s it, we’re going to say, Actually, let me browse here, I’m going to go to the desktop, I’m going to go to get great guitars is where I bought it, I put it into section one.


9:50

And then I’m going to say that I want this report here. So I’m going to choose this financial statement 2020, double click on it, and then export to it. So here we have it, we have our similar kind of quirky things that Excel does one, it adds the sheet to the front, I’m going to go on that sheet, I’m going to right click on that tab and delete it. So I’ll remove that tab, then I’m going to go back on the sheet one, this is where they put it, I would like to have this all the way to the right. So I’m going to go ahead and grab it, I’m going to left click on it and grab it and drag it to the right.


10:22

So there we have it, I’m going to remove the split pains, I will typically do this by going to the layout page layout, which is this little icon to the bottom right. And today, okay. And then there’s our splits, we can see them clearly now. So I’m going to go up top to the View tab, the windows group, remove the splits. And there we have that I like to then add the title will I can see the title of top in this view. So I’ll double click on the sheet tab or add the tab title to the tab, which is going to be I’m going to say comparative balance sheet, and let’s say 2020. And then I’ll say back into here, then I’ll go back to the normal view.


11:00

There we have that. So it should look it all fits on one page. It’s a little it’s more than one page long, but it’s okay and one page wide. So I’m okay with that. I’m then going to export this entire worksheet, which includes a balance sheet a profit and loss, p&l, and now the comparative balance sheet to one report. So we’re going to do that by going to the File tab up top, I’m going to say print, I’m going to print it to RQ to PDF printer, and I’m going to print the entire workbook. So then I’m going to print the entire workbook using the cute PDF printer. And then you can see down here we’ve got the preview.


11:37

This is what it looks like all this detail in one workbook, I’m going to then go ahead and print it. And it will then give us the printing option. Now I’m going to save it over this one, I’ve already got it there, I’m going to save it over that one. So I’m going to say save with the same name, replace what I currently have. So this is what we have here we’ve got the financial 2020. If I open out that report, then it’ll include the new one that we have. We’ve got then the balance sheet, we’ve got then the profit and loss report. And we’ve got the comparative balance sheet all in one report.


12:12

This then is something that we can upload or give to someone else in a fairly easy fashion. If we close this back out, that would be easier than if I take I’m going to take this report and I’m going to drag it into our financial reports. Now you can see our financial reports are getting a but a bit longer. And these can get quite substantially long depending on how much detail we want to give to somebody as of the end of the month or the end of the period. And so therefore, we could zip this file, we can attach these three documents, or we can create a zip file with those documents in it. So if I was to just say, okay, we added one, I’m going to delete the zip file, right click on it and create another one. That means we can attach this zip file to an email or we can simply attach this one PDF file that has everything in it which we created through the export into Excel and then the creation of that PDF file.

Fonts & Numbers Report Options 2.25

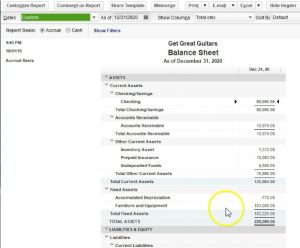
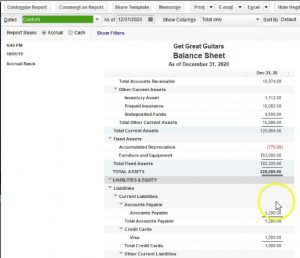
This presentation, we will take a look at the fonts and numbers options within the reports options related to a balance sheet. These options will be found in most other reports as well, we will do this within QuickBooks Pro 2020, QuickBooks desktop 2020. Here we are in our get great guitars file, we currently have the open windows open in order to open the open windows, you can go to the View drop down up top and go to the open windows that list, we’re not going to be going into our balance sheet and continue exploring the options in there, we’re going to go to the reports drop down in order to do so that company and financials and then scroll on down to our favorite report, that being the balance sheet standard report, we’re not going to be considering options and the customized reports.


0:44

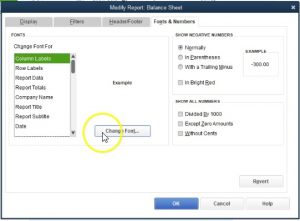
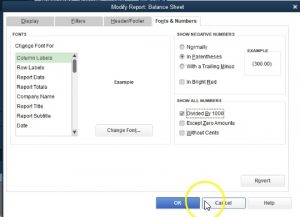
First of all has changed the dates, I like to do that with the range up top, I go into the customized reports, changing the date range from Oh 120 to 1230 120. That’s January through December 2020. And then we’re going to say okay, here’s going to be then our standard report, we’re going to go back up top, we’re going to go to the customized reports once again, this time and go into the fonts and numbers.


1:07

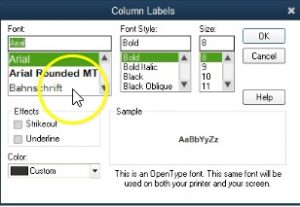
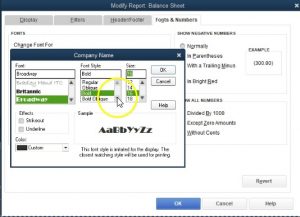
You’ll note to that we skipped the filtering options, the filtering options will make more sense and particular type of reports will spend more time into filtering options when we get to other types of reports where this will be a useful tool for us. So we now are going to go back to the fonts and numbers. Within the fonts and numbers. We have the change the fonts for the various items that are in the reports. And then we can change the fonts here including the changing of the font, a mountain the font itself, we can change the style to bold to italic, and so forth. And then we can of course change the size as well.


1:45

We also have the effects, which include the strikeout effect, or the underlying effect that can be included. And then we have the coloring options will play a little bit around with these. So you can get a feel for them. These can be a great tool, they can also be over us. So you don’t want to go over the top with it. But if you do a little bit of changes here or there to the QuickBooks report, it really gives a little bit goes a long way it gives a feel to your reports that are a bit different than other types of reports which can can make you stand out I can you don’t want to go too far with them, I would stick with the normal default.


2:17

So you also don’t want to make default settings that would be difficult to do for other types of reports to mimic that default setting. But once you set the default, if you have your customized default, then I’m going to close this out and close this out, you can memorize those reports. And then you don’t have to do it every time. So it could be a great tool to set some of the fonts to be a bit different. If you want to change the title a little bit or memorize some reports, alter some reports and change those titles, then you can do so and again, that could be a nice touch. To have on the reports back to the customized reports up top, we’re going to go to the fonts and numbers.


2:53

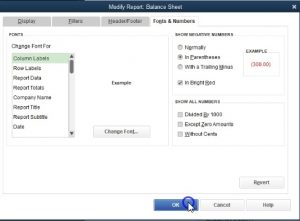
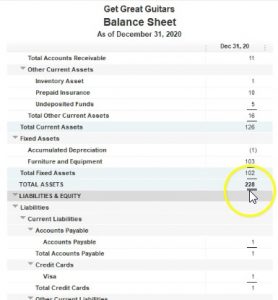
Then on the right side, we’re going to first explore these items on the right side, then I’ll show you a couple examples. On the left, we’re changing things like the color and the font and whatnot. So if we have these show negative numbers, normally QuickBooks will show negative numbers with a negative sign. As we can see here for depreciation, for example, we have a negative 775. I kind of like to see them with parentheses, which they will show like this, it’ll stand out a little bit more. That’s my my personal preference. And if you would like to stand out a little bit more, you can make them read. So it’ll look like that.


3:27

If I was just if I was to select this, then we’ll say okay, now we have that negative number that really kind of pops out for us both being bracketed. And with a negative numbers, you can have it just read and no brackets, or brackets and no read whatever kind of setup you would like to see, we’re going to go back into the customized reports, we’re going to go into the fonts and numbers. The other effect we can have is the negative trailing the number which might be useful in some areas, it’s not something I’m particularly used to most of the time, so I would keep it with the parentheses, I would generally remove the red brackets, that’s just my personal preference, then we can show all numbers.


4:06

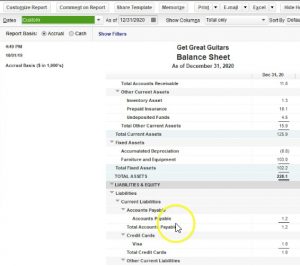
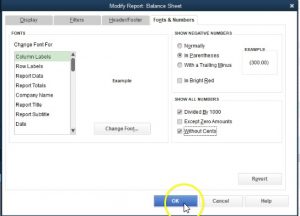
So we can divide the numbers by 1000. Note that I can take all the numbers and divide them by 1000. If I was to check this and say, okay, and if we have long numbers, if we have a lot of numbers, then this can be a useful way to display the numbers. So we can have that as a useful way to display. If I go back up to the customized reports. Typically, if we do that and go to the fonts and numbers, we will also be removing the pennies, we wouldn’t divide by 1000 and a half of the pennies, they’re typically so we would say remove the pennies too. And then there we have it. Without this sense, we can also go back up top customized reports, and go to the fonts and numbers. And we could basically have to thousands but remove the pennies have it have no sense that the reports still make sense, but it has no sense to it has no pennies involved in it.


4:54

So we’re gonna have no sense. Okay. And then we have that type of report. So then we and that can use that can look a lot cleaner, this might be something that’s very useful to do. Some people don’t want to see the pennies that just add up, they just kind of clog up the the viewing screen. And they don’t basically add any more value typically to normal decision making processes. So oftentimes, this is a useful tool to help remove the pennies remove the sense, if we go back up to the customized reports and go to the fonts and numbers. And now let’s take a look at some of these changes to the font styles. Notice you could change like individual areas within the report. So for example, we could change just the column labels.


5:35

If we have a report with multiple columns, like here, the column label, the row labels, the road data, so the actual data, the numbers in it, we have the report totals. So when we go down to the bottom, the total amounts, we can change the fonts there, the company name, which of course is up top here, the report title, so the report title, the report, subtitle, the date, and so on and so forth, let’s take a consideration with the report title. For example, if you wanted to customize your report title in some way, then you can go to the change font. And you know, say you want a different font on the on the report Title I again, I wouldn’t choose anything, that’s two, you want you want pretty straightforward fonts. But if you want something a little bit more bold or something like this, like I wouldn’t choose something like this unless you


6:25

for some particular reason you want a really fancy looking font, on the name possibly. But typically, I would use a, you know, more straightforward font that doesn’t have a lot, a lot of detail into it. But that’s just my preference. Let’s choose one that is a little bit different here. So we can see what that’ll be like. And then I can, I can apply this just there by saying I could make it larger, too.


6:47

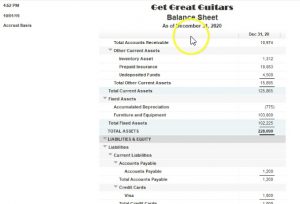
We might say, well, let’s make it 16 font, it’s already bolted. So let’s keep it there. And we’ll say okay, and then it’s going to give you this default change all related fonts. And I’m going to say no, for this time, I just want to do it to the company name, which is what I have selected. Now if I say it’s all related funds, it’ll in essence, apply it out all to the related fun. So I’m going to say no. And then I’m going to say okay, and there we have the company name, his name is going to be different. So I’m not an expert at timeout, you know, the best fonts and whatnot. So these are just some options. If you’re really good with fonts, and you’d like to, you know, mix and match and put the fonts together that looks really nice, then you can you can adjust these in this format, we can then go to the fonts and numbers.


7:33

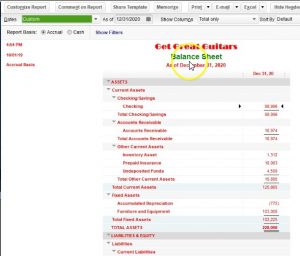
And if I was to say, do this for a color, for example, if I went to the the report title, and we wanted to change the color to it, I can make it something like a green color, here’s the color drop down. And we could say okay, and then again, I just want to say no, just apply it there. And then Okay, so then we have the color changed. If you want to change something like the color or the font of everything, you can go to the customized reports up top, you can go to the fonts and numbers. And for example, if I was going to go to the company name, or let’s go to the report totals, and I wanted to change the font, and I wanted to make them all a certain color, let’s say you know, say red, and then I said okay, and then if I want to change all related fonts, I can just simply choose change all related fonts, and say yes, and then Okay.


8:27

And then you could see basically it apply that to all related fonts, pretty much all the fonts here, except for the other one that we had changed previously. So again, you can mix and match with these type of things. I wouldn’t go too far with him but a little bit, a little bit of your personal touch on the fonts, a little bit of change from just a standard, I could make your reports pop a little bit a little standout and might be worth doing. And once you do them, you can memorize them which will show in a future presentation.

8:53

So you wouldn’t have to redo it every time. We’re going to go back to the fonts if you want it to revert back, then you would go to revert back. And okay, that’ll revert it back note also if you wanted to reverted back obviously, you can just delete you can just close the report and start a new report. You know and do it again. If I didn’t like all the red there or whatnot. I do it just closed the report up top. Go back into reports. Go back into the company and financial make a new balance sheet standard. Adjust the dates up top 201 a 120 to 1230 120 January through December, and then we can just go back in and make any adjustments we need from a fresh report.


Header Footer Report Options 2.20

0:00

This presentation we will take a look at the header and footer options within a balance sheet reports there will be similar header and footer options in other reports as well, we will do this within QuickBooks Pro 2020, QuickBooks desktop 2020. Here we are in our gift great guitars file, we currently have the open windows open, you can open the open windows by selecting the view drop down up top and go into the open windows list.

(more…)

Balance Sheet Display Options 2.15

Its presentation and we will take a look at the display options for a balance sheet type report options that will typically be applicable to many other types of reports as well within QuickBooks Pro 2020, QuickBooks desktop 2001 a. Here we are in our get great guitars file, we currently have the open windows open, you can open the open windows by selecting the view drop down up top and go into the open that windows that list, we’re now going to be going to the balance sheet standard report and taking a look at the customized options or the display options within it.

(more…)