
Corporate Finance PowerPoint presentation. In this presentation, we will discuss the DuPont system of analysis Get ready, it’s time to take your chance with corporate finance, the DuPont system of analysis, the DuPont system of analysis is going to be focusing in on a key financial ratio, that being the return on equity or our OE, the ROI he is calculated most simply as net income divided by equity, what we’re going to do is take this return on equity and break it out into components, those components drilling down on areas in the business, allowing us a better analysis in those areas and given us some opportunities to improve different components of the business. So it allows us to basically drill down and get more detail on the return on equity.
00:49
Now, why is the return on equity such an important ratio in and of itself? For that, we could just consider the accounting equation and think about the accounting equation here first. So the accounting equation is assets equal liabilities plus equity, remember that the assets are what the company has the liability and equity represents, who has claim to those assets, or otherwise known as basically the financing of the assets? How did we get the assets in other way, in other words, either we have a loan for them, we took out the debt in order to purchase the assets in the hopes of revenue generation in the future, or equity, meaning the equity of an initial investment by the owners, or the accumulation of equity through revenue from the business. Now we can rewrite this as assets minus liabilities equals equity.
01:43
And this format, this is often used in a finance type format, because it’s going to emphasize the fact that equity is the book value of the company, its assets minus liabilities, assets, what the company has liabilities, what the company owes. And then the net assets is basically the net assets or the value of the company, which is attributed to the owner. Now, if you think about this accounting equation for like an initial investment, let’s say we’re starting an initial business, and you were to put you wanted $100 of assets in order to start the business, then you can, you can imagine this equation as being $100 equals, if you took out a loan, if you were able to get $60 loan plus $40 of equity, then you can imagine that we have $100 of assets. $60 is owed to the bank. And $40 is basically what was put in by the owner into equity before any revenue was generated, we could rewrite that then as assets minus liabilities equals equity.
02:43
And therefore if we were to just, you know, take out, take the money out and pay off the loan, then the business at this point would be worth the $40. That being the initial investment if that’s what we started the business with. Note that whether we finance the business with debt liabilities, or equity, we now have the assets of $100. And the assets are what we’re going to need in order to generate a return in the future. So a return in the future is going to be represented on the income statement on the income statement being the performance statement, revenue minus expenses, giving us the net income, that’s going to be our return. When we think about the return on assets, comparing the return compared to our assets, we’re thinking about how efficiently we are using what we have with no matter how we financed it with debt or equity.
03:27
When we’re thinking about the return on equity, as we are here, we’re thinking about the book value of the company assets minus liabilities, book value, and comparing our return compared to the equity, which in this case, is what the company had what the owner has put into the company. So our return on equity then will be calculated most simply as net income over equity, net income being the performance number on the income statement, that’s gonna be our return, that’s going to be revenue minus expenses on the income statement, divided by the equity, which if you’re thinking about this as like the initial investment, that’s how much the owner put into the business, as opposed to how much was financed within the business. Now we can break this out into different ratios, we can actually pull this apart into three different ratios. And you might think about, like, why would I do that mathematically?
04:19
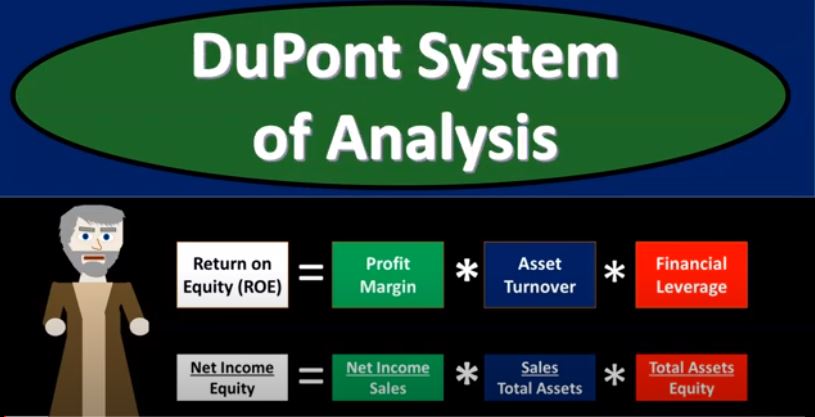
Why would we pull it into we’re gonna pull it into these three ratios, profit margin, asset turnover, financial leverage. And you might think, well, that’s great that you can do that. But I’ve always thought that mathematically, it’s best to simplify things. When you take a math class, you typically have three ratios that you’re going to try to distill down to one ratio, the simpler, the format that you can represent something is typically better in mathematics. Why would you pull it apart? Well, if we pull it apart, then we can use these three components to basically drill down on different components in the business and be able to analyze our performance on them, as well as project in the future to make decisions in the future to see how we might be able to improve within them. So it’s Really useful for us to kind of break these down.
05:02
Now these two of these first two we are very familiar with, we will get very familiar with this last one’s a little bit more tricky, and we’ll spend a little bit more time on it, but we’ll talk about it intuitively first, and then we’ll break it down in more detail. So we can break down the return on equity r o e, as profit margin times asset turnover times financial leverage. profit margin is going to be calculated as net income over sales. net income is the bottom line of the income statement. Sales is the top line of the income statement. So we’re basically seeing how much return we are getting. So you can think about it as if every dollar sale, how much of that dollar are we keeping after having the expenses, right? How much of each sales dollar is actually going to the business, increasing the equity of the business as opposed to being spent in order to get that dollar of sales. And then we have the asset turnover, which is sales over total assets.
06:00
So that’s the top line of the income statement, revenue sales divided by total assets, which is our balance sheet number. And we’re trying to see how efficiently we’re using our assets in order to generate sales, how efficiently are we can are we using our assets what we have, that’s why we that’s why we look put money into the business to get the assets here, so that we can then increase the sales, right? So sales are increasing sales compared to the total assets, then we multiply that times the total assets divided by equity, that’s going to be the financial leverage calculation. Now, this one isn’t a ratio that we typically see basically, in and of itself, although we can derive it with ratios that we will be using. And we’ll do that later in the presentation. But you can kind of look at it intuitively right now.
06:47
And we’ll do some scenarios where you’ll be able to see intuitively why this ratio works total assets divided by equity, the financial leverage ratio, and then we’ll derive this ratio after that with ratios that we will more commonly use in and of themselves. Now, if you’ve heard the term financial leverage, you may know that it has to deal with debt. And if you look at this ratio, then you might ask, Well, why does Why aren’t their liabilities involved? Here are some kind of debt liabilities, you would think would be related to the debt, but I don’t see that in the ratio. But if you break it down, intuitively, you’re looking at total assets divided by equity. And if you think about, okay, what if I wanted to increase this component of our calculation here? What if I wanted to increase this ratio? How would you do that? Well, you can increase the total assets and try to keep equity basically the same?
07:36
Well, how could you increase the assets and keep basically equity the same, you can increase the liabilities, right, you can take a loan out, which means you can increase the cash and keep the equity the same. And that’s how you can see it kind of intuitively, that this is related to leverage. Now we’ll again, we’ll derive it more later. But just for now, you can kind of see it in that format. So now mathematically, you can see that if we multiply these three together, it’s going to be equal in net income over equity. Because if you were to cancel these items out, you’d be cancelling the sales and the sales and you’d be cancelling the total assets, and the total assets being left with the the net income over the equity, and the net income over the equity would be the same as the return on equity. So we basically just broke out the return on equity to these three components. So now we can focus in on these three components and look at past performance for a company and see what their profit margin is compared to their turnover compared to their financial leverage.
08:39
And if we want to make changes in the future, we can make changes to any of these three components and think about them in more of an isolated standpoint, so that we can deconstruct what is actually happening. So let’s go ahead and do that. Let’s do some kind of scenario, where we’ll change one of these items, or each of these items and see what will then happen. And then we’ll be breaking down this ratio in a little bit more detail. So let’s take a look at this in a vertical format. Right How right now we have it listed horizontally. What if we just take these three and we list it vertically, it would look like this profit margin times the asset turnover times the financial leverage ratio is going to then equal the return on equity. And let’s just put a scenario here. Let’s say this is our information we’ve got the equity investment is going to be 1000. So the owner puts into the business, we’re going to say they’re starting a business they put in 1000 all themselves, they don’t take out any loan, they put in all their own money in the business.
09:38
That means the total assets are also 1000. At the beginning of this, then we’re going to say that the sales happened of 10,000 that that they generated sales have the 10,000 and then the net income bottom line is 2000. After after activity, okay, so what would then our ratios do? Well, if we took profit margin would be the net income of 2000 divided by the sales of 10,000, to give us a profit margin of point two or 20%. What does that mean? means for every sale that we have every $1 of sales, we’re keeping 20 cents of it, or for every hundred dollars of sales, we’re keeping $20 of it, then if we look at the asset turnover, the assets, turnover is going to be the sales of the 10,000 divided by the assets, the assets that we generated, when we initially put in the money from the owner, that’s going to be the 1000. The sales is the top line of the income statement. So we’re measuring how well, we are using our assets in order to generate the sales. So for every dollar of assets that we have, we’ve been generating $10 of sales.
10:43
And then if we take a look at the financial leverage, we’re going to be taking the total assets, which are total assets here divided by equity, divided by equity, and equity. And the assets are the same, because we have no debt at this point in time. Therefore, the total assets is equal to the equity. And if we divide that out, we get one, so we have one there. So now if we multiply these three together, then we have the point two times the 10, times one, which is going to be two, so we have a return on equity of two. And then if we calculate the return on equity here, note that if we do the simple calculation, on the one step scenario, instead of breaking it out, we would get the net income net income of 2000, over equity of 1000, which, once again, is two.
11:33
So notice, you also can see here that if we take a look at these first two items, we’ll see later that this will be equal to return on assets, which we’ll take a look at. And you’ll see that these two if we multiply these two together or return on assets, return on assets is calculated as it as net income, the net income divided by the assets, which are 1000. And that would give us two, so these two will actually be the return on assets. And and they’re going to be the same here because there is no debt at this point in time. Because there’s there’s no loan taken out. That means that the assets and the equity are the same at this point.
12:10
Now let’s change one of our items. Let’s first change the profit margin. So let’s figure our change to the profit margin. How could we change the profit margin? Well, let’s say that net income goes up to 2500. Even though we have the same amount of sales, how could that happen? How could net income go up bottom line of the income statement when sales hasn’t gone up? Because we’re more efficient, we have less expenses, right? So now we’re saying okay, how, you know, what’s our profit margin, that means for every dollar sales we have, because we’re using our expenses more efficiently, we now have a profit margin of point two, five, or we’re keeping 25 cents for every sale that we have, or for every hundred dollars, we’re keeping it $25, the asset turnover is going to be the same, we have the sales over the total assets, we still have an asset turnover, our assets are generating $1 of sales each or so for our thousand dollars of assets, we have 10,000 in sales, we have no debt still, therefore, our financial leverage calculation of assets is 1000 over equity of 1000 is still one.
13:16
So if we multiply this together, the point two five times to 10 times to one is 2.5, which is equal to if we calculate our return on equity as net income over equity, the 2.5. So notice how this calculation up top gives us more information, more things that we can kind of drill down on. Let’s focus in on the second component. This time, we’re going to take a look at the asset turnover. So our original data is the original data in scenario one. And now we’re going to go and look at scenario two now, which is going to be an increase in the assets turnover. asset turnover is sales divided by the total assets. So how can we increase this number? Well, we can increase sales, we can increase sales. Now note that the increase in sales will also increase net income. But we’re going to say that the profit margin is the same. In other words, note here that you have the profit margin was at at net income of 2000, and sales of 10,000. Now we have a prop we have net income of 2400, and sales at 12,000. So that means we’re making a profit still meaning for every dollar of sales, we’re still getting 20 cents.
14:26
Basically we’re going away with 20 cents, but sales went up. So the profit margin stayed the same but sales has has increased. And then if we look at the asset turnover, now for that same thousand dollars of assets we invested into the company, we are generating sales of 12,000. So for every dollar of assets that we have, we’re generating $12 now of the sales, and then we still have no debt. So now we’ve got the $1,000 assets divided by equity of 1000. So that is one if we multiply the point two The 12 and the one, we get 2.4. So once again, we’ve increased the return on equity. This is a demonstration of how we can do so if we calculate it down here, with net income over equity net income is now at 2400. Over equity, we have the 2.4. So now when we compare scenario one, and scenario two, you can see how scenario, you know, this scenario gives us more detail when we break it out.
15:25
Because now we could say, Okay, what did we do? Did we increase the profit margin? No, we got we increased the sales and the profit margin stayed the same, right? And we didn’t do anything to leverage. Now let’s do the last one and the most controversial and confusing one, that being the financial leverage having to deal with debt. So we’re gonna say, all right, beginning scenario is is the first scenario we had this is equivalent to the first scenario, but before any changes the starting scenario, and we’re now going to say, Okay, now we’re going to adjust the financial leverage. Now, how would you adjust the financial leverage? Well, the financial leverage can be adjusted if we have debt now. So now we’re going to say that instead of the owner putting in the entire $1,000, the owner puts in 500, and takes out a loan for the other 500. Okay, so the rest of the data is the same, because we still have the thousand dollars of assets. So you would still, we still have the net income of 2000, and the sales of 10,000, profit margin is at that 20%. Now note, this is a little deceiving.
16:29
Because if we took out a loan, we would probably have to pay interest on the loan. And that would probably affect that would be an expense that would affect our profit margin to some degree, it may be significant or not, depending on the amount of a loan and the interest rate we have. So we want to just have one factor changing. So just realize that this, that the loan could change this to some degree, that’s going to be basically the rent on the borrowed money that we’re going to have. And so that will be a factor, that would probably be included as well, but we’re going to keep it one factor changing at a time here. And then we have the asset turnover. So we still have the total assets of 1000, that generated the sales of 10,000. So we’re just for every dollar of assets, even though we the owner didn’t find put the money in we got a loan for it, we still have those 1000 of assets, and we still are able to use them to generate the the $10 per dollar of assets or the 10,000 in sales.
17:26
And then we have the financial leverage rep leverage calculation or the multiplier calculation. Now we have assets of 1000, we’ve got the assets of 1000. But the equity is only 500. Which means that we we got another 500 FOMO loan. And that’s what they call this a multiplier effect sometimes because now that’s going to increase this to two. And so therefore, now if we multiply this out point two times 10%, times two is going to increase our return on equity, double it to four. and if we calculate that this way down here, we’re going to say it’s the net income divided by the equity is going to give our return on equity at four here.
18:05
So notice that when you think about these three items that you can do notice that these two, if you if you can increase these two without having a negative impact on the other, then that would be pretty much universally thought of as a good thing. If you can, if you’re increasing the leverage in order to increase the return on equity, there’s kind of a debate as to how good that is. Because note that if you take out if you take out too much of a loan, then you’re going to add risk in case of a problem in the future. If you’re over leveraged, and there’s a problem in the market for some reason, you can’t generate any more sales, then if you could be in a situation where you can’t really get any more financing because the markets down, and you’re already over leveraged.
18:49
However, if you’re able to take out leverage to some degree, you can see how if you are getting if you have a good profit margin, and if you’re still able to increase sales, like if I could increase this total assets here, and I was able to maintain a sales increasing at $10 per asset that I increase, then you would think that it would be worthwhile then to generate more assets through through debt to some degree, so that you can then have the earning potential on it in the future. So that’s why this this one’s going to be somewhat controversial as to whether it’s going to be good or bad and how much leverage that you have. So when you consider the return on equity note that you wouldn’t know that that kind of breakout if you just look at this one calculation, but if you break it out into its components, then you can say okay, you know, why is this difference happening is which component is it due to, if it’s if there’s a difference if you’re comparing two companies and there’s a difference in the return on equity.
19:52
If it’s due to these two factors, being more efficient in one company to another, then that would be a pretty strong indication. If that’s the only factors that are different that they’re doing, they’re doing better for some reason in that area. If it’s if it’s due to financing or leverage, then you’re gonna have some skepticism or at least want to be able to know whether the financing is too much, then you’re going to take a look at the debt and see how much risk there is there as well with regard to financing. Let’s break down this item. And we’re going to consider this to a little bit more degree. And we’re also going to consider these two as they are related to another ratio that we consider. So if we take this same calculation, we have return on equity equals profit margin times asset turnover times to financial leverage.
20:39
So it’s useful to to know that that if we multiplied together the profit margin and the asset turnover, we’re going to get the return on assets, the return on assets. So to see that we’re going to so if we were to cancel out the sales in each item, we are left with net income over total assets, net income over total assets is known as return on assets or our a, now the return on assets is going to be important, because that’s going to be seen how much of a return we’re getting for the assets that we have. Remember, the accounting equation is assets equal liabilities plus equity assets is what the company has on the balance sheet. And we’re trying to see how efficiently we are using that asset those assets in order to get a return the net income, the return being the bottom line of the income statement.
21:25
So now we can kind of simplify this item or this equation, this equation up top, we’re going to combine these two together again, it’s nice to have them broken out. So that we can look at these three components as we did in the example problem, and drill down on which one we want to change or which one is causing any kind of difference that we are looking at. Now we want to combine these two together, however, so that we can then focus in on the financial leverage, which is total assets over equity, and equation that we don’t typically see in and of itself, we don’t, in and of itself. So we want to focus in on that looking at ratios that we typically do use, therefore we’re going to combine this together. And so we can then say,
22:05
Okay, this is now being combined down to just return on assets, which is a ratio, we know which we’re going to have the orange ratio now, which is net income over total assets, therefore net income over total assets or return on assets, times the financial leverage, which is the total assets over equity, that kind of a little bit strange one, but when we understand intuitively, is now going to be equal to the return on equity. So now let’s break this down a little bit further, it’s be a little bit confusing, but we’re gonna we’re gonna get to we’re gonna, it’ll make sense in the end here. So we got the financial leverage we’re focusing in here. So we’re going to start with we’ve got the return on equity r, e, that’s going to be same as this return on equity up top is going to be equal to the return on assets are Oh a that we saw on the prior slide, divided by one minus debt to assets, one minus debt to assets. Now this one’s purple, this is going to be a new one, it is exactly what it sounds like debt compared to assets.
23:01
But this is one that we will be working with it’s a it’s a ratio that is more common in and of itself, where we don’t see this one as often in and of itself. So we’re going to basically derive this with this equation. So return on assets are a over one minus debt to assets. Now, you can then transform this and we’ll see this with the ratios shortly, you got the return on assets over equity to assets. In other words, if if one minus debt to assets is going to be equal to equity to assets, so let’s look at that with the ratios and just consider why that would be the case. So if we think about return on assets, that’s the ratio of net income over total assets, net income over total assets, all of that over one minus debt, compared to total assets, which is exactly what this one sounds like this is the new one, the purple one is going to be the new one here.
23:52
Now if we know the debt to the total assets, then we will know the equity to the total assets, which we’ll be seeing here. So we have the same numerator, return on assets, net income over total assets divided now by equity divided by total assets. So notice one minus debt to total assets is equity to total assets. Why? The if you consider the accounting equation, assets equal liabilities plus equity, and you were thinking about this equation debt compared to assets, that’s going to be the liabilities 60 over the 100 of assets, that would be 60%. If you know that 60% you know that equity to assets would have to be the 40 over the 100 or 40%. So if you know the liabilities to assets that one minus or 100 minus 60% would be 100% minus 60% would be the 40%. So therefore, if you know the debts compared to total assets, which is a common ratio we would use, we also know the equity compared to the total assets because the assets that the company has is financed either through debt liabilities or equity.
24:17
and you were thinking about this equation debt compared to assets, that’s going to be the liabilities 60 over the 100 of assets, that would be 60%. If you know that 60% you know that equity to assets would have to be the 40 over the 100 or 40%. So if you know the liabilities to assets that one minus or 100 minus 60% would be 100% minus 60% would be the 40%. So therefore, if you know the debts compared to total assets, which is a common ratio we would use, we also know the equity compared to the total assets because the assets that the company has is financed either through debt liabilities or equity. So now we’re at the net income over total assets, which is The return on assets and equity compared to total assets. So if we consider if we consider that that is going to be equal to if we actually do the math now, to do a division of two different of two fractions, what we do is we take the denominator, and we convert it from a from a division problem to a multiplication problem by taking the inverse of the denominator. So now we’ve got the net income over assets total or total assets times total assets over equity. And then if we cancel out the total assets, we will be left with net income over equity. And that once again returns us to the return on equity return on equity. Now, the reason we did this whole thing is because now you could see that this total assets over equity is this number, that is the multiplier, the financial leverage calculation. So we’re kind of deriving just to show you how we could get to that total assets over equity with ratios that will typically use in and of themselves, so we didn’t just come up with this number, you know, out of nowhere, you can see how it’s being derived from, you know, what we what we typically already use, and again, you could see it kind of intuitively, how it would relate to debt and the amount of leverage that the company has
24:56
So now we’re at the net income over total assets, which is The return on assets and equity compared to total assets. So if we consider if we consider that that is going to be equal to if we actually do the math now, to do a division of two different of two fractions, what we do is we take the denominator, and we convert it from a from a division problem to a multiplication problem by taking the inverse of the denominator. So now we’ve got the net income over assets total or total assets times total assets over equity. And then if we cancel out the total assets, we will be left with net income over equity. And that once again returns us to the return on equity return on equity. Now, the reason we did this whole thing is because now you could see that this total assets over equity is this number, that is the multiplier, the financial leverage calculation. So we’re kind of deriving just to show you how we could get to that total assets over equity with ratios that will typically use in and of themselves, so we didn’t just come up with this number, you know, out of nowhere, you can see how it’s being derived from, you know, what we what we typically already use, and again, you could see it kind of intuitively, how it would relate to debt and the amount of leverage that the company has