

This presentation and we will take a look at the calculation and payment of sales tax. In other words, we’ve made sales within the system that is required to have sales tax on them. We’ve been calculating the sales tax. Now we want to make a payment for that sales tax. Let’s get into it with Intuit QuickBooks Online. Here we are in our get great guitars file, we’re first gonna go down and take a look at some reports. So we’re going to go down to the reports down below. Let’s first take a look at our trial balance report.
Posts with the QuickBooks tag

Record Sales on Account 8.40
In this presentation, we’re going to record a sale on account. In other words, we can also call that a sale on credit. In other words, the form that we’re going to be using in QuickBooks will be to record an invoice. Let’s get into it with Intuit QuickBooks Online now. Here we are in our get great guitars file, we’re going to record an invoice. We’ve seen this in the past, so we’re going to do it a bit faster here. If we go to our flowchart from the desktop version, we’re going to be recording the invoice the difference between an invoice and the sales receipt is that we have not yet received payment.

Apply Credit Or Advanced Payment to Invoice 8.35
This presentation and we’re going to apply a credit or an advanced payment to an invoice. In other words, we got paid in advance by a customer recorded that into the system. Now we’re going to create an invoice and apply that event advanced payment to it. Let’s get into it with Intuit QuickBooks Online. Here we are in our get great guitars file, we’re first going to take a look at our flowchart in the desktop version.

Customer Jobs or Sub Customer 7.65
This presentation and we will set up customer jobs or sub customers. In other words, if you’re working with QuickBooks desktop, people will typically call them jobs. If you’re working with QuickBooks Online, they’re using the terminology of sub customers. Let’s get into it with Intuit QuickBooks Online. Here we are in our get great guitars file. Before we go any forward, let’s take a look at our flowchart within QuickBooks desktop.
Company Preferences Checking 6.006
This presentation, we will continue on looking at the company preferences, this time focusing in on the checking preferences, although we will also take a quick look at the bills and the calendar preferences within QuickBooks Pro QuickBooks desktop 2020. Here we are in our get great guitars file, we’re going to go back into the preferences by going to the Edit drop down up top, and we’re going to go back down to our preferences, edit and event preferences, we did the accounting last time, we’re going to be moving down from accounting will be stopping at the checking item here.

Company Preferences Accounting 6.004
This presentation, we will take a look at company preferences focusing in on the accounting preferences within QuickBooks Pro QuickBooks desktop 2020. Here we are in the QuickBooks system, we’re at our homepage. Typically, when I’m in the homepage, I usually like to have the open windows open. So usually every time I go in here, we go to the View tab, and we go to the open windows list. And that’s what I would prefer doesn’t really matter here with what we’re doing.
0:26
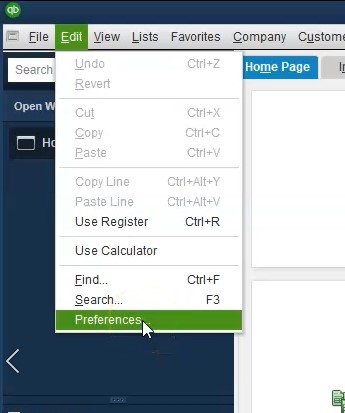
But that’s typically the system I will have every time, we’re then going to go to the preferences to do so we will go to the Edit screen up top will scroll down to the company preferences, and we want the company preferences. Now there’s a lot of preferences and they could be confusing, you’ve got the preferences on the left, that will be by category, you also typically will have tabs up top depending on what preference you are in for my preferences in the company preferences. So we’re going to go through a lot of these mini the default settings are pretty good. So don’t be too overwhelmed because the default settings are generally good.

0:59
And they’ll okay to move forward. With a practice problem like this. In particular, we want to go into the company settings so that we can get rid of some annoyances such as time, our time constraints, that will give you a warning type of thing when we’re working in the past or the future.
1:15
They’re not as effective. We also just want to discuss the company preferences, because different people have different preferences. And if you set up on or you sit on someone else’s computer or someone else’s QuickBooks files with different preferences, and you can start to annoying and have annoying little things happen. And you say, Well, why is that different, it’s just the way the preferences are set up. And you can see where those are at and understand what’s going on.
1:36
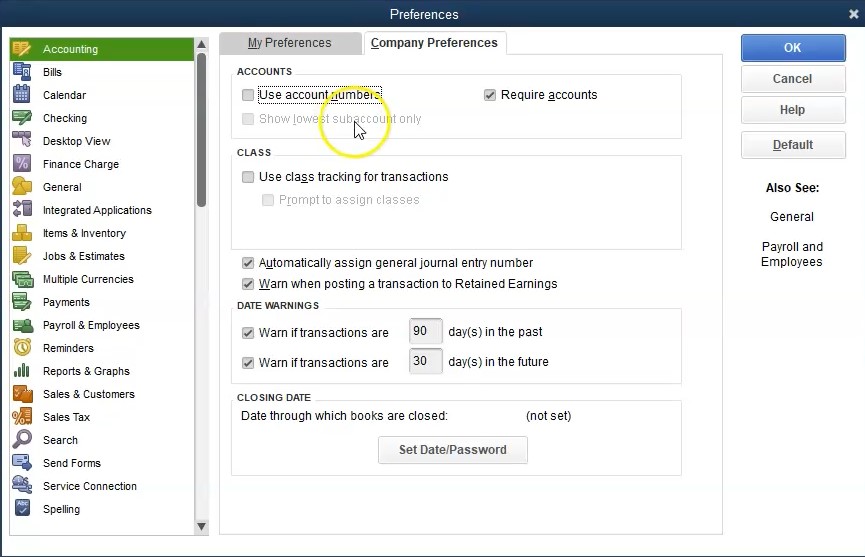
Therefore, we will start at the top with the accounting preferences, you’ll see there’s two tabs up top we have the my preferences and we have the company preferences, we then have nothing in the my preferences, which is nice and makes it easy, we’re going to go into the company Preferences Tab, then we have the user account numbers and require accounts. Now, if you select the use account numbers, notice it’s not the default over here is the default. And other words, not having account numbers is basically the default.
2:03
If you’re if you use account numbers, they can be very useful because they give you a lot more control in the ordering of the accounts that you have. However, if you do not have experience with account numbers, and you put account numbers and you don’t understand the ordering system, you can really kind of muddy the waters and make things not not good. And therefore, if you know about account numbers, you can put them in if you’re not, you can put the default and it will order the trial balance the way we have seen it previously, that being by basically account type assets, liabilities, equity, income and expense and the subcategories of those including cash, accounts receivable, types of assets, and then the other current assets and so on.
2:43
And then within those categories, those types, it’ll order by alphabetical order. So that’s where the control could happen. If you don’t want it order by alphabetical order. Within the account types, you can use the account numbers. So we’ll discuss that a bit more detail later, we might do a presentation simply on accountant numbers show the control that they can add. But for now, we’re not going to include them.
3:04
And then we have classes use class tracking for transactions. This could be a great tool for some types of things. If you want to if you want to group things separately for class tracking, it could be very useful for things like job tracking, if you’re going to class different jobs, or different segments or different regions. There’s various uses for class tracking, we may put some presentations later on when you would use class tracking. But by default, typically, most companies don’t need the added feature.
3:32
That’s why By default, the class tracking is not included, we’re going to keep that they’re automatically assign at general journal entry numbers. So when you make a general journal entry, like the debits and credits, it’ll automatically basically assign a number to it. That’s basically a useful practice to have, therefore, we will keep the account setting they’re worn when posting a transactions to retained earnings.
3:57
Why would it do that retained earnings is an equity account. So the equity account is an account that usually is only used when something is closed out to it, such as basically the you know, when you close out the income statement to it, net income is going to close out to the equity assets, liabilities, equity.
4:13
So it’s unusual, therefore, to post things to the retained earnings. So it’s saying, Hey, we’re going to tell you that you’re doing something a little bit unusual, we will from time to time post something to a retained earnings type account, and we’ll see this warning pop up, I’m going to keep it there, however, so that we can, you know, see that it will pop up and say, hey, that’s okay. When is it? Okay? When is it not?
4:34
Okay, so it’ll it’ll give us that warning, then we have the date warnings. So Warren, if transactions are 90 days in the past, Warren of transactions are 30 days in the future. Now, this is a great tool, if you’re working in real time, if I’m putting my transactions in daily, or you know, within the same month, then of course, it’s very possible that you someone can miss key, put the wrong date the wrong year, and now you got something posted totally in the wrong period. And that’s not good, right.
5:03
So it’s really nice to have these saying, hey, you posted something way out of the range. And so you want to change that. Now you could increase the range if you’re if you’re lagging in your posting. And therefore, and you know, you don’t want to have a big mistake, like post the wrong year. So you might up these ranges, to make them larger. If you’re so forth. For example, if you’re doing bookkeeping and someone gave you something, and you want to enter all your data for the whole year, or if you’re a business owner, I know no one, this wouldn’t happen anybody here, right.
5:32
But if you if you had no bookkeeping for the entire year, and you wanted to put together the whole bookkeeping for the whole year, because you need to do your taxes at the end of the year will then the 3090 range isn’t going to be helpful, because you’re going to be going back to dates way past that. And it’s going to give you a pop up every time you do that.
5:50
However, if you wanted to say, hey, I want to be within a year’s range, you could just increase these ranges. And that might help you from at least putting in a day a year that’s completely wrong. In this practice problem. Because we have to work in the past or the future, that we’re going to remove the date ranges because if you’re working the problem, I don’t want you to get have this pop up screen happening all the time. So again, very good in practice, not good. If you’re working far in the past, you could change the ranges.
6:22
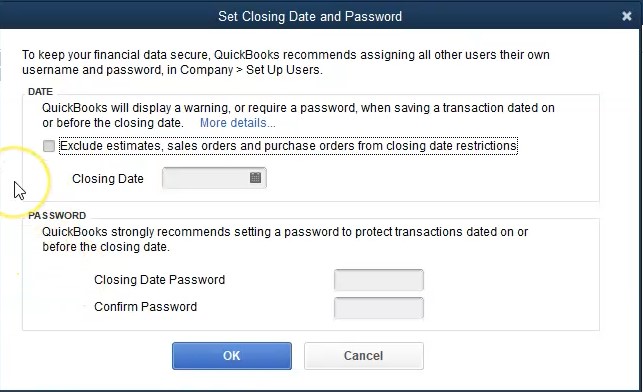
However, if you’re working at a future or past date, for some reason, these will be very annoying as they pop up all the time. And then lastly, we have the closing date, date through which books are closed that we have the set up process here says to keep your financial data secure, QuickBooks recommends assigning all other users their own username and password and company set up users.
6:45
So then we have the date, QuickBooks will display a warning or require password when saving a transaction dated on a before the closing date. And then we can include the date here and this can help us there’s a lot of the problems with bookkeeping is to say, hey, the books are closed for this period, as of now and so we don’t want any transactions to be posted to the prior period. So you could basically say, Hey, you know, close that date, give a warning. If that if that time period is closed, if you don’t, you know, things can get messed up in terms of rolling over the books.
7:14
So we’re not going to deal with that now. And we’ll we’ll mention that as we start to go through the process. And then the password. QuickBooks strongly recommends setting a password to protect transactions dated on or before the closing date. So it’s going to say hey, don’t what you’re basically saying here is that, hey, this, this period is closed, do not mess with this period or any date prior to this period.
7:35
We’re basically done with that period. And you can only do so if you have a password that can really help people from you know, going back and adjusting things or making an adjustment to a prior period which can cause problems. So we’re going to go ahead and keep that as is and then we’re going to go to I’m going to just basically say okay, and close this out and we’ll move on to the next preferences next time. If you make any changes when you say okay, it’s going to ask you to save those two inches as you do so.
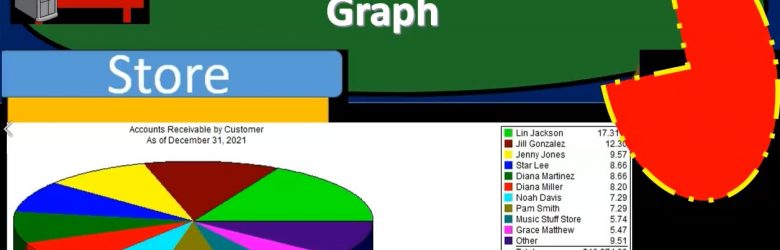
Accounts Receivable Graph 4.50
In this presentation, we will create an accounts receivable graph within QuickBooks Pro 2020 QuickBooks desktop 2020. Here we are in our get great guitars file we currently have the open windows open, we can open the open windows by selecting the view drop down and the open windows lyst.
0:18
We’re now going to be considering an accounts receivable graph whenever we think about any graph or report, other than the major financial statements balance sheet and income statement, we want to consider what account and which of those financial statement reports are going to be supported with the report or graph we are running. In this case, accounts receivable will be a balance sheet account.
0:38
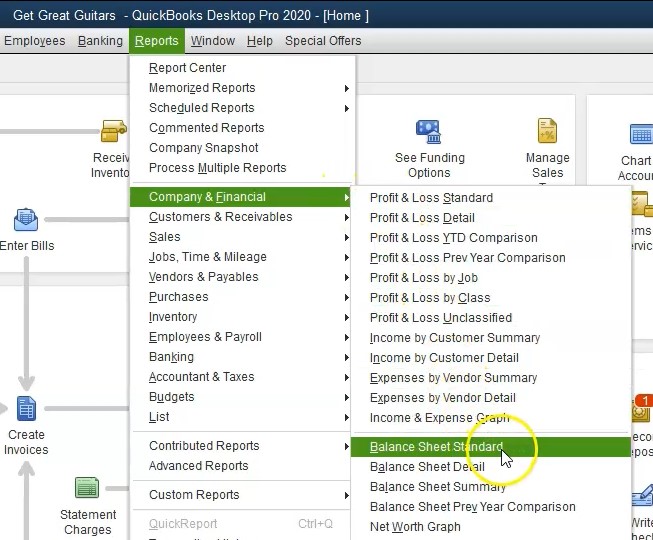
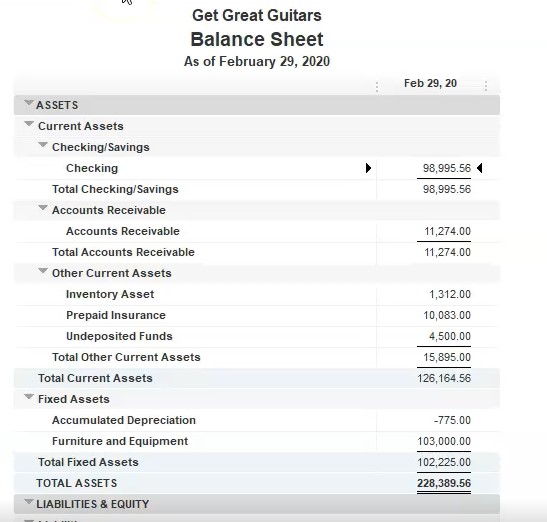
Therefore, let’s first open the balance sheet we’re going to go to the reports drop down up top, I’m going to go to the company and financial and scroll on down to that balance sheet standard report the balance sheet standard report we’re going to take the date as of Oh to 29 to zero in February. Remember the balance sheet is as of a point in time accounts receivable is of course, right here that represents money that is owed to us by customers. So now we want to think about the accounts receivable report, which will break out what is owed to us by customer.
1:08
Also note, we could run another report that would help to support this detailed that being Of course, of report we’ve seen in the past reports drop down. If we go to the customer and receivables we’re looking at the customer balance Summary Report. And that will give us our customer balance information. And in a summary format, we’re at 10,009 74. If I change the dates up top 202 29 2020 229 to zero, we’re at the 11 to 74. If we go back to the balance sheet, we’re at the 11 to 74.

1:44
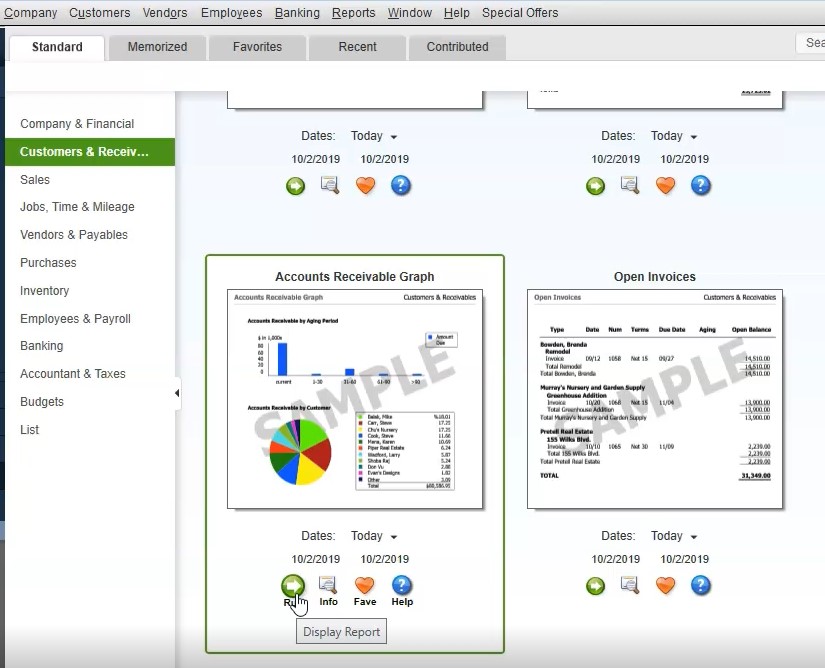
Next, we’re going to run the graph, a couple ways we can get there, we can go to the reports drop down and we can go to the customers and receivables and find the graph here. Or we could use the report Center by going to the reports drop down and the report center. So let’s go into the report center. We’re in the standard tab, I’m going to maximize the sheet by selecting the maximize tab here. And then on the left hand side, we want the customers and receivables within the customers and receivables.
2:12
I’m going to scroll down till we get to our graphs. Here’s the accounts receivable graph, we can run the report, we can change the dates on the report I saw I choose I usually will simply run the report so I’m going to run it, then we’ll change the dates on it, nothing’s here. Is it a date problem? Yes, it is we’re going to go back up top and change the dates for it.
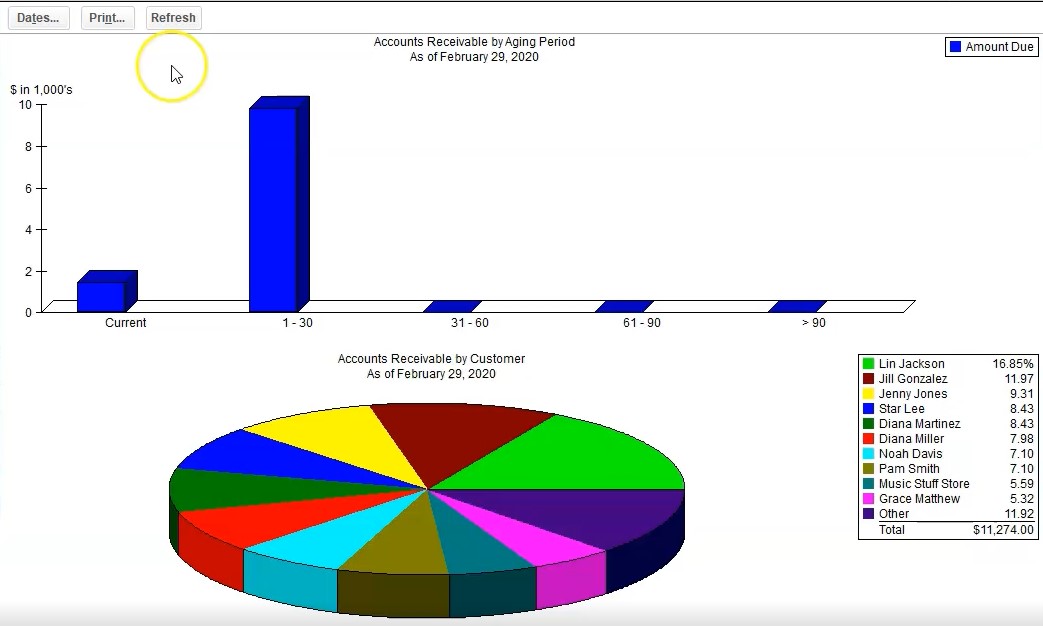
2:32
Change the date to go to 20 920 noting once again that it’s going to be at the end of February. And there’s only one date because it is as of a specific point in time, how much do people owe us who owes us as of this point in time, we have the key to the right, which is going to be listing the people that owe us which are going to be customers. And then of course, the graph in the middle of the pie chart for us the total been adding up to the 11 to 74 that then matching what’s up on the balance sheet back to the balance sheet, we see the 11 to 74. If we go back to our graph, then we can take this number note we can create this graph.
3:10
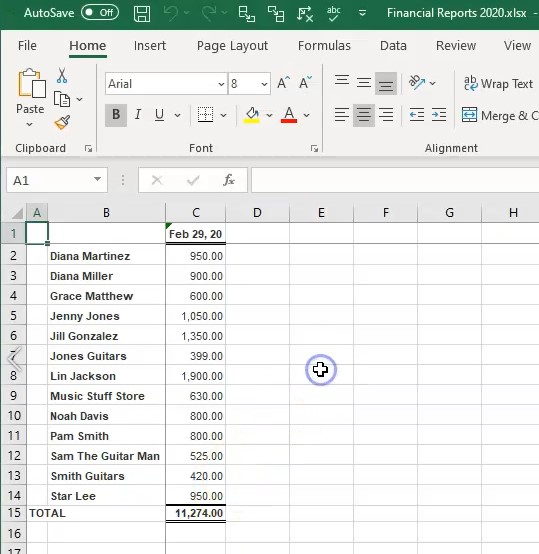
How is this graph created? Well, if we were to take the customer balance summary report back to the customer balance summary in the open windows, export this to excel, we can see how to basically create this graph in Excel if you want to use that and make your own graph and make it a little bit more flexible in that format. Let’s do that. And then we’ll copy and paste the graph from QuickBooks and see how we can use those items as well.
3:35
We’re going to go to the Excel laptop, we’re going to create a new worksheet, we’re going to put that new worksheet into an existing workbook when we have created in the past, and we’re going to select the browse, there’s the workbook we want going to double click on it, we will then export to in here is our Excel worksheet, we’re going to do our normal kind of formatting, I’m going to go all the way to the left, we’re going to click on this screen with the instructions, right click on it and delete it, then I’m going to say delete, I’m going to go all the way to the right, then I’m going to pick up this new sheet, I’m going to pull it all the way to the right, I’m just going to drag it left clicking on it to the right, then we’re going to do some formatting in the Page Layout tab, I’m going to go to the Page Layout View, I’m going to say okay, we’re going to go to the View up top so we can remove the splits there, I’m going to go to the View up top windows group and remove the splits, I’m going to double click then on the name, I’m going to call this and ARAGR graph, let’s just say accounts receivable graph, that’s what we’re going to be making from this. Now note, we might want to read rename the title up here, like I haven’t done in the prior ones, this is going to be a bar graph, you know, and that’ll be on the title.
4:46
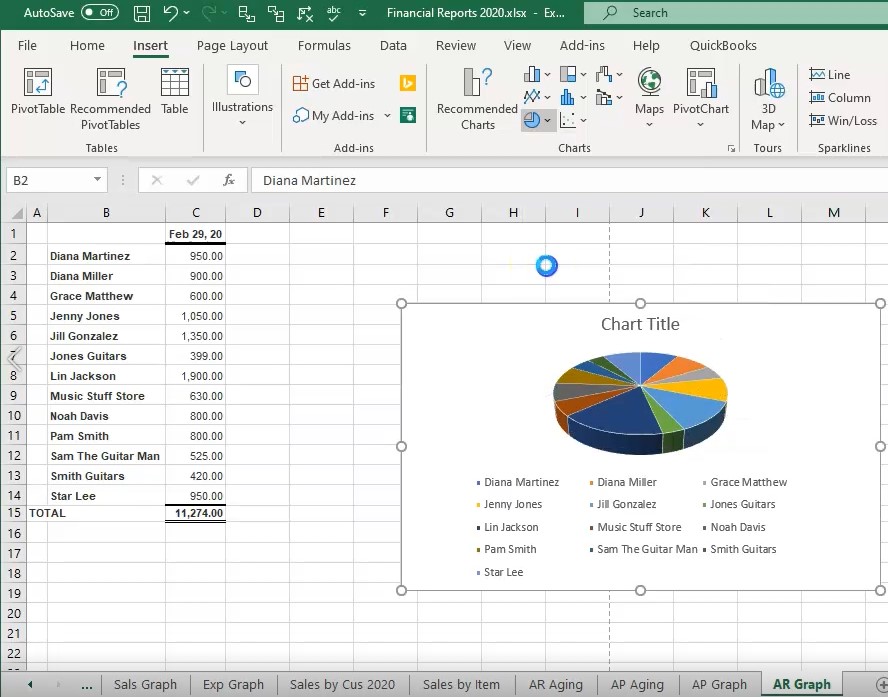
And then I’ll go back over here and back not there, but back here. And then we need to basically make our graph. So all I have to do is highlight these numbers, then go to the Insert. And then we go to go, we want a pie chart, we’ve been making these 3d pie charts. So we’ll make that one. And there we have it. So that’s another format. Another way you can make the graph, you could rotate the graph, you can put a name up to up top, or you can delete it, you can then put the percentages into it if you if you so choose by formatting the graph.
5:17
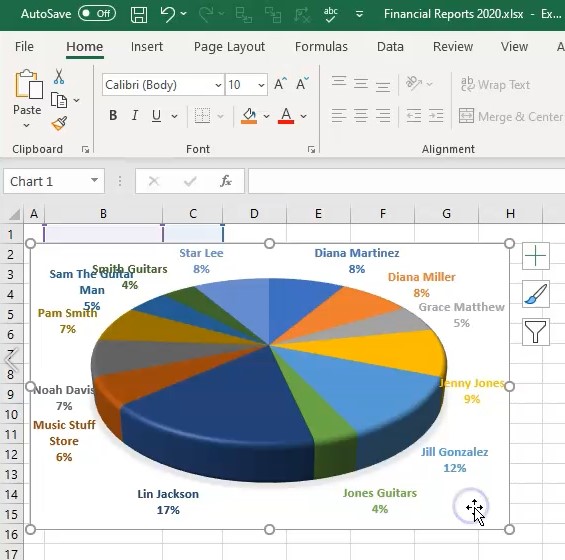
So for example, if I chose a different format, it might it’ll look something like this, we could put the percentages in here again, you’d have to mess with it to get it, you know, to look as nice as you would like it. Let’s go back up top and go to the the first one here, I’m going to go back up top and select this one here. And then we can adjust these around and make this look as nice as much nicer. But there’s a lot of different formats, we won’t go into all the formatting in Excel here. But in any case, I’m going to put this down below. So we’ll put it below the data.
5:48
Now also know you might want to hide the data in some way, if you don’t want to print the data, like there’s a couple ways you could do, you could try to hide the data or you can even you can just hide the font, even if I was to select all of this information, and go to the Home tab, and then go to the color of the font and make it say white. And then I can I can remove basically, I don’t even need this top number, right click here and delete. And I don’t need the total. So I can get rid of that formatting, right click and delete.
6:19
And then you can basically put your graph right on top of the data. And then and then you can actually print this report without, you know showing the data but just showing the graph if you would choose if you so choose to. And then I’m going to put the graph from Excel right underneath it or the graph that we’re going to copy from QuickBooks, let’s go back to QuickBooks. Here’s our graph there, we’re going to go back to excel, just insert that by going to the Insert tab, we’re going to go to the illustration, we’re going to go to the screenshot, and then I’ll take a clipping of it.

6:49
I’ll take a clipping of this graph. So we’ll just pick up that graph. There it is, and then I’ll take a clipping of the key. So I’m going to go below it, I’m going to go to the illustration, going to go a screenshot, we’re going to take a clipping then of the key. So here’s the key will take that up, and that’ll be right below it. And so there is that. So that looks pretty good. Now we’ll print this entire thing to a PDF file will go to the File tab up top, we’re going to go to print, and then we’re going to print it to a PDF file, we’re going to save the existing the entire workbook, we want the entire workbook, which is going to be including 20 pages now, then I’m going to go to the printing up top.
7:30
And then it’s going to be printing those 20 pages, we’re going to see where it wants to go. And here is our dialogue box, we’re going to go into financial statements, I’m going to call this actually, we’re going to be putting this into here, I’m going to double click on the financials, and say save. Yes. So there we have that, then I’m going to go back to QuickBooks, and I’m going to print this one. So we’re going to go to the reports, I’m going to go to the printing up top, we’re going to go then print it to a cute PDF printer and print this item.
8:09
It’ll then get a give us the printing dialog box. We’re going to put this into the financials, and I’m going to pick I’m going to name it then the counts, let’s say accounts receivable graph. There we have it, and then we’ll save that there. And then let’s see what we have in our folder. If we go to section one through four, within I’m going to delete this bottom one, we don’t need that.
8:37
If we go into the financial reports, then we have all these financial reports that we could then put on an email, we could zip it, I could right click on this and zip the files so that we can then send just that zip file in an email or we can send the Excel worksheet, or we could send this PDF file which has everything included in one PDF file so far that we done which includes the balance sheet, the profit and loss, the comparative balance sheet, the summary balance sheet, the income statement, the comparative profit loss, vertical profit and health, vertical analysis, grasp of the expense and sales.
9:17
And then we have the sales by customer summary. We’ve got the sales by item, we’ve got the accounts receivable, we got the accounts payable, aging, then we have a graph, then we have the vendor balance. And then now we have the accounts receivable graph here. Again, we could probably format these graphs a little bit nicer. We certainly don’t want this on the other page here so we can get rid of that. But we won’t go into a lot of detail here. That’s just an example of how you can basically format these in different fashions.

Accounts Payable Graph 4.40
This presentation we will create an accounts payable graph within QuickBooks Pro 2020, QuickBooks desktop 2020. Here we are in our get great guitars file, we currently have the open windows open, you can open the open windows by selecting the view drop down and then the open windows lyst.
Set Up New QuickBooks File For Both Business & Personal Bookkeeping
New QuickBooks file designed to be used for both business and personal record keeping with the use of QuickBooks class tracing feature.
It is generally recommended to have two QuicKBooks files, one business and one personal, and two bank accounts so that we keep business records as separated as possible. However, some small business owners may want to track personal and business expenses in one QuickBooks files.
We will set up a QuickBooks file designed to track both business and personal expenses and use the class tracking feature to show how such a system could work.
What Month End Documents Should A QuickBooks Bookkeeper Provide To Client
List, description, and formatting of month end documentation for a small bookkeeping business. We will list out forms and documents a bookkeeper can provide to a client at the end of each month.
The forms a bookkeeper provides are the end product and service provided and it is best to format them in as presentable a way as possible.
When working with small clients and even large clients the main concert of the bookkeeping client is often year end. The monthly Quickbooks documents help to provide assurance that the QuickBooks bookkeeping client is in good hands.
The bookkeeper will need to generate standard financial statement type documents including the balance sheet and profit and loss, or income statement.
The bookkeeper may also generate accounts receivable detail reports from QuickBooks, as well as deposit and check detail. QuickBooks also has the capability of generating some graphs and charts that can look nice in the monthly documentation. If the bookkeeper in running payroll or working with a payroll company payroll reports and helpful as well.
Once the reports are generated from Quickbooks, the bookkeeper needs to decide how to deliver them. The bookkeeper can mail the reports or provide them in some kind of digital format. The bookkeeper can e-mail the reports with PDF file attachments.
When e-mailing it is nice to zip the file for easier client use. QuicKbooks also allows the bookkeeper to export reports to Excel and we can use the Excel report to generate one PDF file with multiple reports which can help with the presentation of the financial information.
For more accounting and QuickBooks instruction see accounting website.