
Corporate Finance PowerPoint presentation. In this presentation, we will give an overview of financial statements Get ready, it’s time to take your chance with corporate finance, financial statement overview, the financial statements will be the primary tool that will be used to value the company, the financial statements are going to be generated from the company.
And when we’re thinking about investors in the company, the investors will be using those financial statements in order to value the company to determine the price the market basically determining the price through investors then creating a value or perceived value of the company, which is based primarily on the tool that being used the financial statements. So if you’re thinking about this, from an investor perspective, if you’re an investor perspective, and you want to know about the company to see whether or not you want to invest in it, you’ll typically want to know at least two things, you can categorize two things within that your mindset, you’re going to say,
00:59
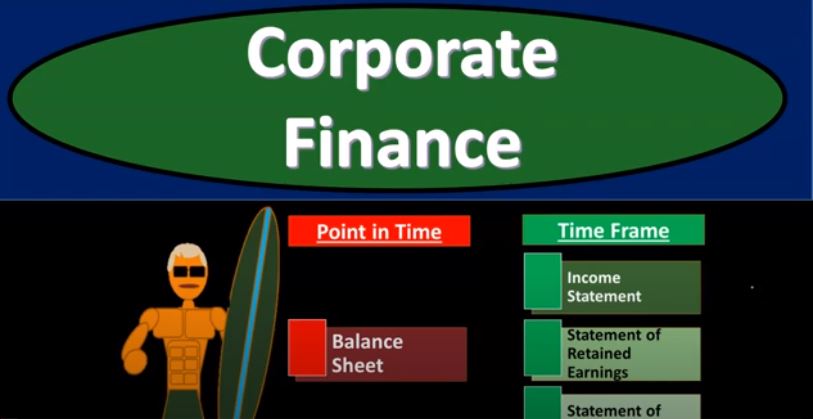
Okay, what is the value of the thing I’m buying right now? So what is its current value? Where do you stand at this point in time in terms of the valuation? And you want to know performance? how likely are you to be able to generate revenue in the future? Are you going to grow? Is your valuation going to be increasing in the future? So those are the two things we’re basically looking at? Where do you stand now? How likely is it that you’re going to be growing in the future? And how fast will that growth be? That’s the information I need to determine what your current value will be. So you want to break the financial statements into those two components, or we can break the financial statements into those two components to provide those that information. So when is going to be the point in time, that’s going to be the balance sheet. So first, where do you stand as of now, so if you think about the balance sheet that represents what the company has their assets, minus what they owe liabilities equals basically the equity or book value in the company.
01:59
So this, this has given you a valuation, as of now as of this point in time, and you’re going to say, well, that’s great, but I’m not simply going to invest just on or the markets not going to value the company, simply on their balance sheet on their assets minus the liabilities, they’re not going to value the company on the things they own, minus who you know, the liabilities that they owe to book value of the company, that’s not typically going to simply be the value of the company, because there’s also earning potential is their earning potential in the future. And so for that, you need a timing statement. Now, when you think about a timing statement, all you can do is look at the past, right? You can look at the past and say, How well did they do in the past? Therefore, how likely are they to do well, in the future? If you’re looking at a runner, you can say how fast they’ve run them the mile last time?
02:47
How fast do you think they’re going to run it in the future time? Or if you’re thinking about how many miles could a car drive in, you know, an hour? How well did they do last time? How Many Miles Do you think they’re going to drive next time? Those are timing statements to measure to measure past performance that will be used typically to predict future performance? When we think about the valuation from an investment perspective, that’s going to include the income statement, which is the primary statements you want to think of with a timing statement. That’s going to be our performance statement. How well did you did did you do last year? And how likely are you to do that next year? If you look at the last two years, or some is there an upward trend? Do we think that trend is going to be increasing? So the income is revenue minus expenses? How well did you do? How much revenue Did you generate? How much expenses that you incur to do that, and the net income being the bottom line, we also have the statement of retained earnings.
03:43
Now, the statement of retained earnings is going to be kind of a link between the balance sheet and the income statement. So once you get the idea of a point in time in a timeframe, you also want to get the idea of this double entry accounting system idea in place. How do you get from the income statement to the balance sheet, meaning the balance sheet is as of now if you’re talking about the year ended? December 31, is what you’re looking at the balance sheet is as of December 31. The income statement is the timeframe January to December? How do you get from the income statement to to the balance sheet? How are those things related? Well, we’re going to need the statement of retained earnings to kind of link those two two debt together. So it’s kind of a timing statement. But it’s going to link together the prior point on the balance sheet to the current point on the balance sheet last year compared to this year linked together the income statement and possibly dividends, then we have the statement of cash flows.
04:38
Another timing statement because you’re looking at flows of cash, meaning we’re not looking at cash as of now with the statement of cash flow because that’s what you do on the balance sheet. How much cash Do you have now as of 1231, after December 31 cash flow statement is measuring the flow of cash from January through December what what flows happened through that time period. You might ask what’s the difference between the statement of cash flows and the income statement? Well, the income statement is what we’re going to be called on an accrual basis and the cash flow statements on a cash flow basis. So the reason we have the income statement on an accrual basis is because we want to recognize revenue and expenses. When they were actually done, meaning we want to recognize revenue when the work was done typically and expenses, when we actually consumed something in order to help us generate revenue in that time period, if we were to use cash flow to measure, then the there could be major distortions based on pre payments paying before you get something or, you know, getting paid by the customer before you actually do the work.
05:44
So the cash if we were to depend simply on cash flow, there could be major distortions in the measurement process. Therefore, we’re required to use or we will use and if you’re a publicly traded company, you typically will be required to use and accrual basis. However, cash flow is still really important, because we want to make sure that the there is sufficient cash flow. And that’s a healthy thing to so we also need the statement of cash flows as well. Okay, so here’s a quick overview, we’ll go through this in a little bit more detail in a future presentation. But the best way to just get a handle on these financial statements is to just, you know, look at them. So here’s an example of a balance sheet. So the balance sheet once again, measures where we stand at a point in time, it consists of what we’ll call it, the accounting equation, assets, equal liabilities plus equity. And you can see that we are in balanced by the fact that the bottom line should tie out in terms of total assets should be equal to the liabilities plus the equity.
06:44
So that’s going to be normally that the accounting if you’re an accountant, that’s how you see the accounting equation, assets equal liabilities plus equity assets represents what the company has. Now, of course, when you measure what the company has, you measure them in dollars, or whatever unit of currency that you are using, where I would think about dollars here, right, so we’ve got $100,000. But then we also have like inventory, which we’re valuing at $430,000 worth of inventory, not 40 130,000 units of inventory, right? So we’re valuing all this stuff in some way, shape, or form on dollars. And then the liabilities are what we owe, so we owe liabilities, to a third party, the the equity represents then what is owned by the owners, or in other words, you can think of this as assets is what the company has, it’s one side of the coin. The other side of the coin is who has claimed to those assets, either third party liabilities, or owner’s equity. So if you think about it in that light, if you want to think about well, how can I value this company? What’s basically the book value of this company? Where do they stand at this point in time, you could say, well, the company in total has assets of two to 35000. And then they have liabilities minus the liabilities of the 1015000. That means that the book value then is equity of 1,220,000. So if you if you look at the balance sheet that tells you that’s telling you basically where the company stands at this point in time, they have basically a book value of 1,220,000.
08:27
Why do I call it a book value and not fair value, because we don’t some of these assets, you know, they’re not being traded currently on the market. So we don’t know the price of inventory, we don’t really know for certain, unless someone actually purchased it, or the property, plant and equipment, for example. And sometimes we’re going to use a historical cost. So that’s going to be one jumping off point or starting point that you can use to help you to value the company. But it’s not the end value. Now, if you were thinking about the valuation of the company on a market, then you could say, okay, that’s how many that’s the book value. What if I took that and i and i allocated it out to the owners, and it’s like, well, who are the owners, the owners are the shareholders. So So and notice the shareholders are broken out into into standard units of ownership. So because their standards units of ownership, so you can start to think about this, this value being broken out evenly over shares, units of ownership, and we’ll talk more about that. And in a future presentation. However, the markets not gonna base the valuation simply on on the book value because they also want to know, what’s the earning potential maybe there’s earning potential beyond what is on the balance sheet. Maybe there’s like a brand name or some goodwill that will allow the company to earn have earnings past surpassing what simply the book value is on the balance sheet.
09:51
To determine that we’re going to need help from statements that are going to be more of timing statements. So remember, the balance sheet is as of a point in time if you’re talking about financial stuff, For the year ended December 31, the balance sheet is as of December 31. In other words, if you looked at the balance sheet for the year ended December 31, January through December, and, and the financial statements for, for just the month of December, the balance sheet financial statement would be the same for those two sets of financial statements for the entire and you know, if you’re looking for financial statements for the entire year, December 31 2001 month of December, the balance sheet would be the same because it’s as of December 31, what would differ the timing statements, including the income statement, the income statement measures timing. So the income statement is trying to break out how we did performance wise, last period. Because if you know how we did performance wise, last period, then you can you could see if we can project that into the future and see if we’re going to do performance wise as good next period, just like you would if you’re trying to measure how good a baseball player is, or something, how many hits did they have last year, you know, how many hits Do you think they’re going to have next year? Well, all we can look at is past performance.
11:06
So we have the income statement, you can think of as two major components, that being revenue or income, how much how much we took in or how much we earned. And then expenses, expenses are things that we consumed used in order to generate the revenue. And then the bottom line is going to be the net income. So you can think of it on a single step statement, a single step income statement would simply be revenue, how much we pulled in minus expenses, all in one category. And that would give us the 100. And that would give us the net income, which we’re called You can also call earnings after taxes. So that’s basically the top line and bottom line. Now, we typically will break out the income statement in a multi step income statement. So that we can break out most major categories of expenses, such as cost of goods sold the cost of the inventory that we’re using to sell selling, and admins a categorization.
11:57
And then then to get to the operating income, and then interest expense, and then we’ll get to the income before taxes, and then we’ll calculate the taxes on it. And then we’ll finally get to net income. But you can think and the income statement can be quite long because of that categorization. But if you break it down to its normal components, it’s going to be revenue minus expenses. Now, we can also on the income statement breakout and take a look at try to figure out the earnings as they are applied on a per share basis. So once again, if we’re talking about the earnings of the 160,000, and we know that the stocks are broken out ownership is broken out in even chunks called shares, then we can try to say okay, well, how much of the earnings are Alec, Alec allocable to each share, and divide that out. Now preferred stock will muddy the water a little bit, but we’ll talk about that more later. And then we got the statement of retained earnings. So the statement of retained earnings is that linking document because you might say well, how’s the balance sheet related to the income statement now?
12:57
Well, you can take beginning retained earnings, that’s the retained earnings as of the end of last year, or January of this year, and last year, beginning of the current year, then you’re going to take the earnings available to the common stockholder or what was on the income statement, the basically the net income, but then we had to take out the preferred stock. So the earnings available to the common stockholders to 150. So basically the income statement amount. So that’s how much that’s how much value on the balance sheet. That’s how much the value of the balance sheet basically went up the book value, meaning the equity section of the balance sheet went up by that much. But then we also paid dividends, that’s the money that’s going from the company to the owners. So like if you had a if you had a sole proprietorship you would earn money, and then you would draw money out which we would call a withdraw or draw from the owner. Well, how do you do draws in a corporation? Well, you can’t just have individual owners drawing money out, because each individual share is supposed to be the same in in value, the unit evaluation, so you can’t like pay out one shareholder and not the other.
14:06
What you when you, when you pay out the shares, you have to pay out dividends to all shares evenly, which means that one owner might get more money, but that’s because they own more shares. And so we call those dividends. So the dividend is going to be the outflow the money that’s going from the company, they’ve earned money. Now they’re going to give some back to the to the owner in the form of dividends, and that would be the outflow. So the link then be between the equity section, the increase in the value of the balance sheet is the beginning balance. And then you’ve got the net income or earnings available to common stockholders, the bottom line in essence of the income statement, and then you’re going to subtract out the dividends because those went out. So that means that the net indeed balance will be that 600,000. So in other words, the 600,000 is on here’s the balance sheet that’s on the 600,000 here on the balance sheet, okay, and then you have the statement of cash flows and this one is You kind of the other three statements, or you could think of the balance sheet and the income statement basically linked together by the the statement of retained earnings, they’re related to each other.
15:10
And then the statement of cash flows, you kind of think of as like a separate thing, because it’s basically looking at the same data, but it’s looking at it from a cash flow basis. So you’re kind of using a different basis, you’re kind of taking the financial statements that you’ve done on an accrual basis, reformatting, constructing them into a new, a different form, which is going to be the cash flow basis. So the cash flow basis, you can think of it’s similar, at least the top point portion of it is going to be broken out into three portions, cash flows from operating activities, cash flows from investing activities, cash flows from financing activities, the top portion, cash flows from operating activities, is is similar to the income statement in that the income statement ends with basically net income, which is the bottom line earnings on an accrual basis. And what we’re trying to do is get to net income, in essence on a cash basis, meaning or otherwise called net cash flows from operating activities. So this top portion is basically taking net income. And we’re using an indirect method here, you can use the direct method or indirect method.
16:15
We’ll talk more about that later. But most of the time, you’ll see an indirect method, which will take the net income on on the income statement, reverse out or reconcile those items that are accrual items, differences between the accrual basis and cash basis to get to basically net income on a cash basis or otherwise known as net cash flows from operating activities. Now, there could be other cash related activities, including cash flows from investing activities, which which might include like investing in property, plant and equipment or something like that, we call that investing. And we’ll talk more about that later. And cash flows from financing activities, such as loans or bonds that are issued and the dividends are our investing, then we have the the change in the cash flow. And then if we add that to the beginning balance, we get to the actual cash flow on the balance sheet. So the bottom line of the statement of cash flows will tie out to the balance sheet. So the 100,000 will tie out to the end point where we stand at 1231, the 100,000, the top part or the net income, if you’re using an indirect method, the 160,000 will then tie out to the income statement here, the 160,000. So here’s all the financial statements balance sheets.
17:27
Now in a vertical fashion, which you might see it in this fashion, you could see it side by side, oftentimes, it’s represented vertically in this format, because it’s just easier to produce oftentimes that way. And that just means so assets is right here. And that equals the liabilities and equity down below. So when you look at the financial statements, how do they tie together? How does the double entry accounting system work? Well, you got the assets equal the liabilities plus the equity, or assets equal liabilities plus equity. So those two numbers have to equal and you can also think of that as assets minus liabilities equals equity, which means that 600,000 is kind of like the book value of the company. So then you’re going to say, well, how’s the balance sheet related to the income statement, the income statement is a performance number, the income statement represents revenue, minus all the expenses to get down to net income, down to net income, and then we have preferred stock. We’ll talk more about that later, to get to the earnings available to the common stockholder.
18:28
So how is this performance statement related to the balance sheet, the balance sheet is as of the end of the period, the performance statement is measuring how we did over the period balance sheet is as of 1231, for example, December 31, income statement is for the range of January through December. So So how are these two linked together? Well, you can link them together by breaking out basically this, this net value on the balance sheet number, or the stockholder within the equity section, the retained earnings number. So if you break out the retained earnings number, you’re going to get the beginning retained earnings. And then that’s where we were last time period last point in time as of December 31, last year, or January 1 of the current year, and then you’re going to add to it the income statement item up here, and then you’re going to subtract out the dividends.
19:19
This is the missing piece that isn’t isn’t indicated in these other reports. That’s why you need the linking document the statement of retained earnings to get to the 600,000. That’s going to be in the retained earnings. Now notice the stockholders equity that is shown here the preferred stock the common stock and the paid in capital represent basically investments from the owner, the owner, purchasing stock from the company or the stock being distributed by the company. So these are investments in the company. The retained earnings represents what the company has earned and has not yet distributed over the life of the company not just for the last year. And then we have the statement of cash flows the statement of cash flows Once again, we’ll tie out net income should tie out to the income statement. And the ending balance down here should tie out to the balance sheet. So we’ll break out these and we’ll talk about them a little bit more in detail, one by one in future presentations.